Article Text

Abstract
Background Poor vessel wall apposition of flow diverter (FD) stents poses risks for stroke-related complications when treating intracranial aneurysms, necessitating long-term surveillance imaging. To facilitate quantitative evaluation of deployed devices, a novel algorithm is presented that generates intuitive two-dimensional representations of wall apposition from either high-resolution contrast-enhanced cone-beam CT (VasoCT) or intravascular optical coherence tomography (OCT) images.
Methods VasoCT and OCT images were obtained after FD implant (n=8 aneurysms) in an experimental sidewall aneurysm model in canines. Surface models of the vessel wall and FD device were extracted, and the distance between them was presented on a two-dimensional flattened map. Maps and cross-sections at potential locations of malapposition detected on VasoCT-based maps were compared. The performance of OCT-based apposition detection was evaluated on manually labeled cross-sections using logistic regression against a thresholded (≥0.25 mm) apposition measure.
Results VasoCT and OCT acquisitions yielded similar Grading of Regional Apposition after Flow-Diverter Treatment (GRAFT) apposition maps. GRAFT maps from VasoCT highlighted 16 potential locations of malapposition, of which two were found to represent malapposed device struts. Logistic regression showed that OCT could detect malapposition with a sensitivity of 98% and a specificity of 81%.
Conclusions GRAFT delivered quantitative and visually convenient representations of potential FD malapposition and occasional acute thrombus formation. A powerful combination for future neuroendovascular applications is foreseen with the superior resolution delivered by intravascular OCT.
- Flow Diverter
- Endoscopy
- Angiography
- Technology
- Aneurysm
Statistics from Altmetric.com
Introduction
Flow diverter (FD) stents provide a safe and effective technique for endovascular treatment of unruptured intracranial aneurysms.1–5 Unlike the name suggests, in addition to hemodynamic modulation FDs achieve long-term efficacy by remodeling the parent artery.6–8 Importantly, to provide a scaffold for neo-endothelialization, apposition of the device to the vessel wall is paramount. Conversely, device malapposition may result in so-called endoleak and incomplete aneurysm occlusion,9 ,10 while late thrombosis as a consequence of poor apposition increases risks for stroke-related complications from thromboembolic events.11 ,12
In view of the risks associated with complications of FD placement, long-term angiographic follow-up is indicated in all patients. Moreover, intra-procedural visualization of FD and the aneurysm–parent vessel complex is critical to ensure proper device deployment. Two advances in angiographic and endovascular optical imaging technologies that have led to unrivaled views of deployed devices may therefore stimulate improved FD placement with fewer complications. In addition, high-fidelity imaging may lead to better understanding of the mechanisms of action that drive adequate neointimal formation and successful aneurysm thrombosis.
In addition to conventional digital subtraction angiography and angiographic CT,13 ,14 high-resolution contrast-enhanced cone-beam CT (VasoCT) has been introduced as a superior three-dimensional angiographic technique to image stent deployment and parent vessel apposition.15 ,16 VasoCT images are reconstructed from unbinned acquisitions of small field-of-view projection images during a rotational sweep. The advantage of such detailed reconstructions has already been demonstrated for intracranial visualization of stents,17 microcannulas,18 small arteriovenous malformations,19 and FDs.15 ,16
Recent innovations in optical coherence tomography (OCT)20 ,21 have enabled in vivo investigation of the arterial wall and deployed stents with unprecedented detail.22 ,23 Intravascular OCT is based on interferometry to scan the backscatter of a near-infrared light source with low coherence length that is relayed and received through a single fiberoptic wire. The wire is simultaneously rotated and pulled back to obtain a series of cross-sectional images at 100–200 μm intervals. Although commercially available catheters for percutaneous coronary interventions are not yet compatible with the small-diameter tortuous architecture of the intracranial vasculature, its potential for use during neuroendovascular procedures was highlighted by preliminary studies in animals,24 ,25 in case reports of implants in the vertebral artery origin and basilar artery26 ,27 and intracranial internal carotid arteries,25 and in post mortem28 and ex vivo25 cerebrovascular settings.
However, identification and interpretation of poor device apposition from these large three-dimensional datasets is an often qualitative and time-consuming task. We therefore present GRAFT (Grading of Regional Apposition after Flow-Diverter Treatment), a two-dimensional visualization of FD apposition to the arterial vessel wall obtained after semi-automatic image post-processing, and an evaluation of its performance on VasoCT images in comparison with concurrently obtained measurements with intravascular OCT in an experimental sidewall aneurysm model in canines.29
Methods
Animal model
All animal experiments were approved by the institutional animal care and use committee. Two sidewall aneurysms were created on each common carotid artery (CCA) in female canines (n=5) by anastomosis of sections of the detached right external jugular vein, as described previously.29 Under fluoroscopic guidance (Allura Xper FD20, Philips, Best, The Netherlands), FD stents (Pipeline Embolization Device, EV3-MTI, Irvine, California, USA; Surpass, Stryker, Fremont, California, USA) were placed. In n=4 animals, apposition was assessed in the right CCA with both VasoCT and OCT using a 2.7 F outer diameter catheter (C7 System/Dragonfly Catheter, St Jude Medical, Westford, Massachusetts, USA).
Image acquisition
Pull-back OCT image series (270 or 540 frames covering 54 mm vessel length, 10 or 20 mm/s pull-back speed) were obtained during manual flushes with viscous contrast material to generate a blood-free field-of-view. Raw OCT images (504 lines, 968 pixels/line, 10 mm field-of-view) were processed and analyzed using in-house developed software.
VasoCT images (617 non-binned projections, 20.4 s rotation) were reconstructed at 50% of the field-of-view (34.5 mm cube) volume at highest resolution (5123 isotropic voxels), yielding a 67 μm resolution.
Image post-processing
We developed separate post-processing pipelines for VasoCT and OCT to obtain surface models of the stent and the vessel wall from the three-dimensional reconstructed images. Image post-processing was performed using the Vascular Modeling Toolkit (VMTK)30 and in-house developed software utilizing the Insight Segmentation and Registration Toolkit (ITK) and the Visualization Toolkit (VTK). Additional post-processing details are provided in the online supplementary methods.
Three-dimensional models of the vessel wall and FD device were generated from the VasoCT images by extraction of a polygonal mesh following a manually initialized level-set segmentation, and by fitting of a deformable parametric surface to high-intensity voxels that represent stent wires, respectively.
Semi-automatic algorithms were developed for slice-by-slice detection of potential locations of the wire, catheter, stent struts, and vessel wall on OCT images. Occasional areas in the field-of-view that exhibited artifacts from insufficient blood clearance were manually delineated and excluded from the line detectors. Subsequently, individual deformable surface models were fitted to a set of coordinates that either represented potential locations of the vessel wall or that likely corresponded to points on the stent struts.
Image analysis
GRAFT maps of apposition
The minimal point-wise Euclidean distance between stent and vessel wall surface representations was calculated as a local measure of apposition and projected onto the vessel wall surface model. Signed distances were used, where positive values indicate that the vessel wall lies beyond the stent surface, and negative otherwise. Subsequently, local distances were represented on a flattened two-dimensional map with the circumferential direction on the x-axis and the distance in the longitudinal direction along the vessel centerline on the y-axis at a resolution of 0.03 rad×0.03 mm, followed by a 5×5 pixel median filter. For visualization purposes, the resulting apposition maps were capped at −0.4 and 1 mm.
Comparison of GRAFT analysis on OCT and VasoCT
Within-sample spatial matching of VasoCT and OCT images was achieved with a rigid body transformation based on the manual identification of proximal and distal stent center points, proximal and distal aneurysm neck points, and the aneurysm dome.
Regions of potential malapposition were first identified on the apposition maps generated from the VasoCT images by identifying local maxima at least 0.15 mm above the background (as defined by the median distance in the apposition map) in a neighborhood with a radius of 25×25 pixels. Next, for both VasoCT and OCT at the corresponding cross-sectional level, the images and stent and vessel surface contours were rendered for visual inspection.
Evaluation of OCT segmentation
Randomly selected cross-sectional images from OCT (n=100) were manually segmented into stent, wall, aneurysm, catheter, and wire/artifact. These manual segmentations were used to evaluate the performance of the semi-automatic segmentation algorithm. Evaluation was performed on two-dimensional cross-sections through the stent and wall models. Along the vessel wall circumference, median device wall distances were aggregated over at most 50 sections, excluding regions affected by wire/artifact shadows, as a regional measure of apposition.
We subsequently determined the performance of the algorithm to detect malapposition in sections proximal and distal to the aneurysm. For the purpose of training a logistic regression classifier, we labeled distances between stent and vessel wall of 0.25 mm and larger as malapposed. In a leave-one-out cross-validation approach, probabilities of malapposition were obtained for individual cross-sections using the input from all other sections. The optimal cut-off point resembling a balance between sensitivity and specificity was converted to a threshold for the semi-automatically obtained distances that best identified malapposed versus well-apposed regions.
Results
GRAFT: comparison of OCT and VasoCT
Local maxima detection on VasoCT images of eight treated aneurysms revealed a total of 16 non-aneurysm locations that were visually inspected for FD device malapposition. Two samples clearly presented evidence for device malapposition on both VasoCT and OCT (figure 1). In the first sample (figure 1B), the cross-sections at the level of the local maxima identified on VasoCT distinctly visualize incomplete apposition proximal to the FD device on both modalities. The local maximum measured 0.43 mm on VasoCT (figure 2A) and 0.41 mm on OCT. The local maximum distal to the aneurysm resulted from a penetrating side branch (figure 2C), which was not observed on the OCT-based apposition map. In the second sample (figure 1C), inspection of the OCT cross-section at the level of the single non-aneurysm local maximum was found to clearly represent device malapposition with a maximum distance of 0.63 mm and 0.78 mm measured on VasoCT (figure 2E) and OCT (figure 2F), respectively. The corresponding VasoCT slice shows part of the aneurysm dome, indicating that the malapposition occurred very close to the distal end of the aneurysm neck (figure 2E).
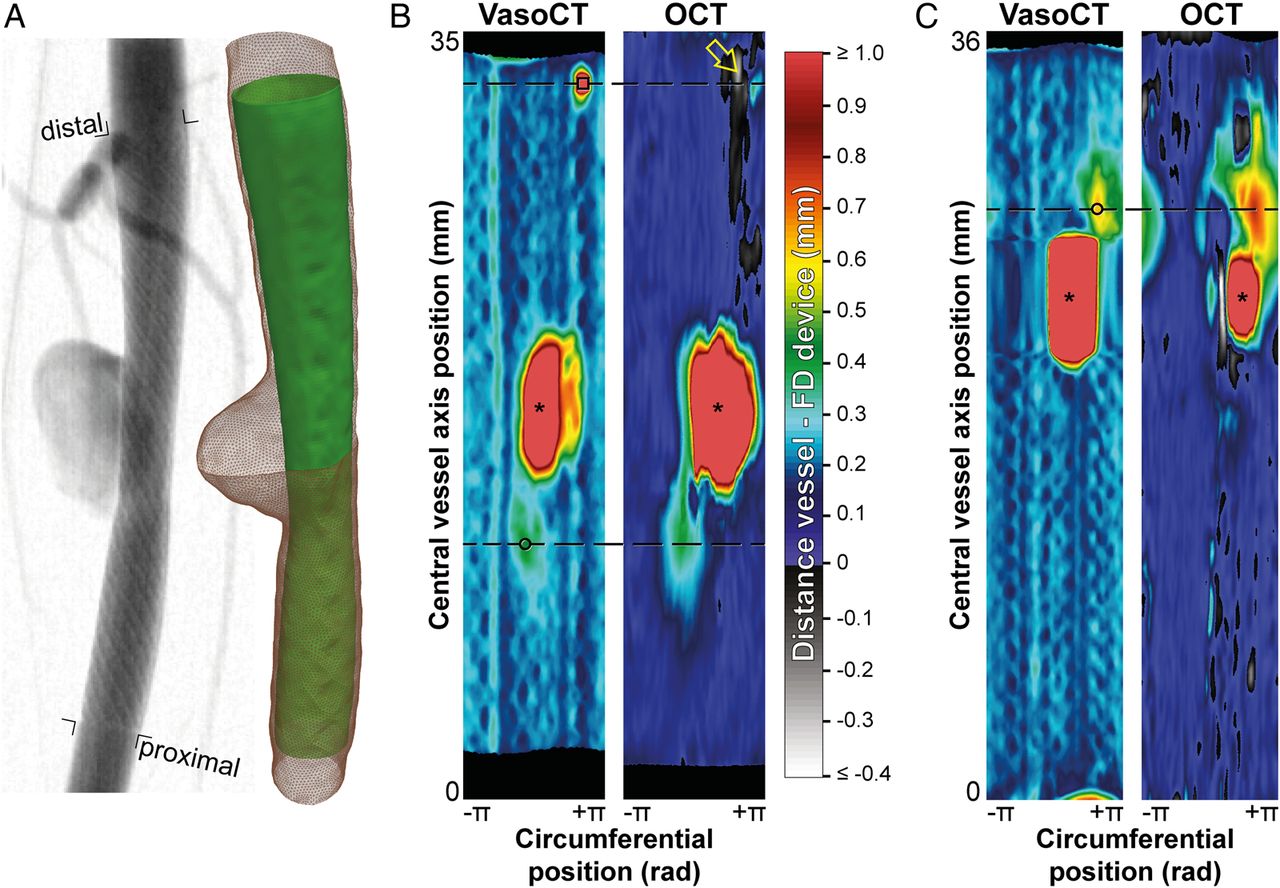
(A) Post-implant digital subtraction angiogram (left) and reconstructed surfaces of the vessel wall (right, red mesh) and flow diverter (FD) device (right, green) for the distal aneurysm on the right common carotid artery (CCA) of animal #1. (B) Grading of Regional Apposition after Flow-Diverter Treatment (GRAFT) apposition maps for high-resolution contrast-enhanced cone-beam CT (VasoCT) and optical coherence tomography (OCT) of the aneurysm depicted in (A). Colors encode distances between FD device and vessel wall. Grayscale rendered regions indicate areas where the stent surface runs outside the vessel surface. The circle and square demarcate the two non-aneurysm local maxima detected in the VasoCT image that are proximal and distal to the aneurysm (indicated by*). Cross-sections along the dashed lines are shown in figure 2A, B (circle) and figure 2C (square). The yellow arrow points to a local minimum on the OCT image which was found to be induced by thrombus formation (figure 2D). (C) Post-implant GRAFT apposition maps of the proximal aneurysm on the right CCA of animal #4. For a local maximum demarcated by the circle and dashed line, stent malapposition was found just distal to the aneurysm neck (see figure 2E, F).

Cross-sectional images of high-resolution contrast-enhanced cone-beam CT (VasoCT) (A, C and E) and optical coherence tomography (OCT) (B, D and F) at positions of suspected malapposition based on detection of local maxima in apposition maps (see figure 1B, C). (A and B) True stent malapposition (×) was found with both VasoCT and OCT. The dashed green lines in (B) indicate a partially obscured field-of-view due to the wire that is positioned next to the imaging head. (C) Elevated device–wall distance on VasoCT was caused by a penetrating side branch (*). (D) In that vicinity, a negative signal on the OCT apposition map was indicative of a thrombus formed on the interface between the device and the side branch (green arrow in D). (E and F) Stent malapposition (marked ×) was found very close to the aneurysm neck. The aneurysm is indicated on the VasoCT cross-section (+ in E).
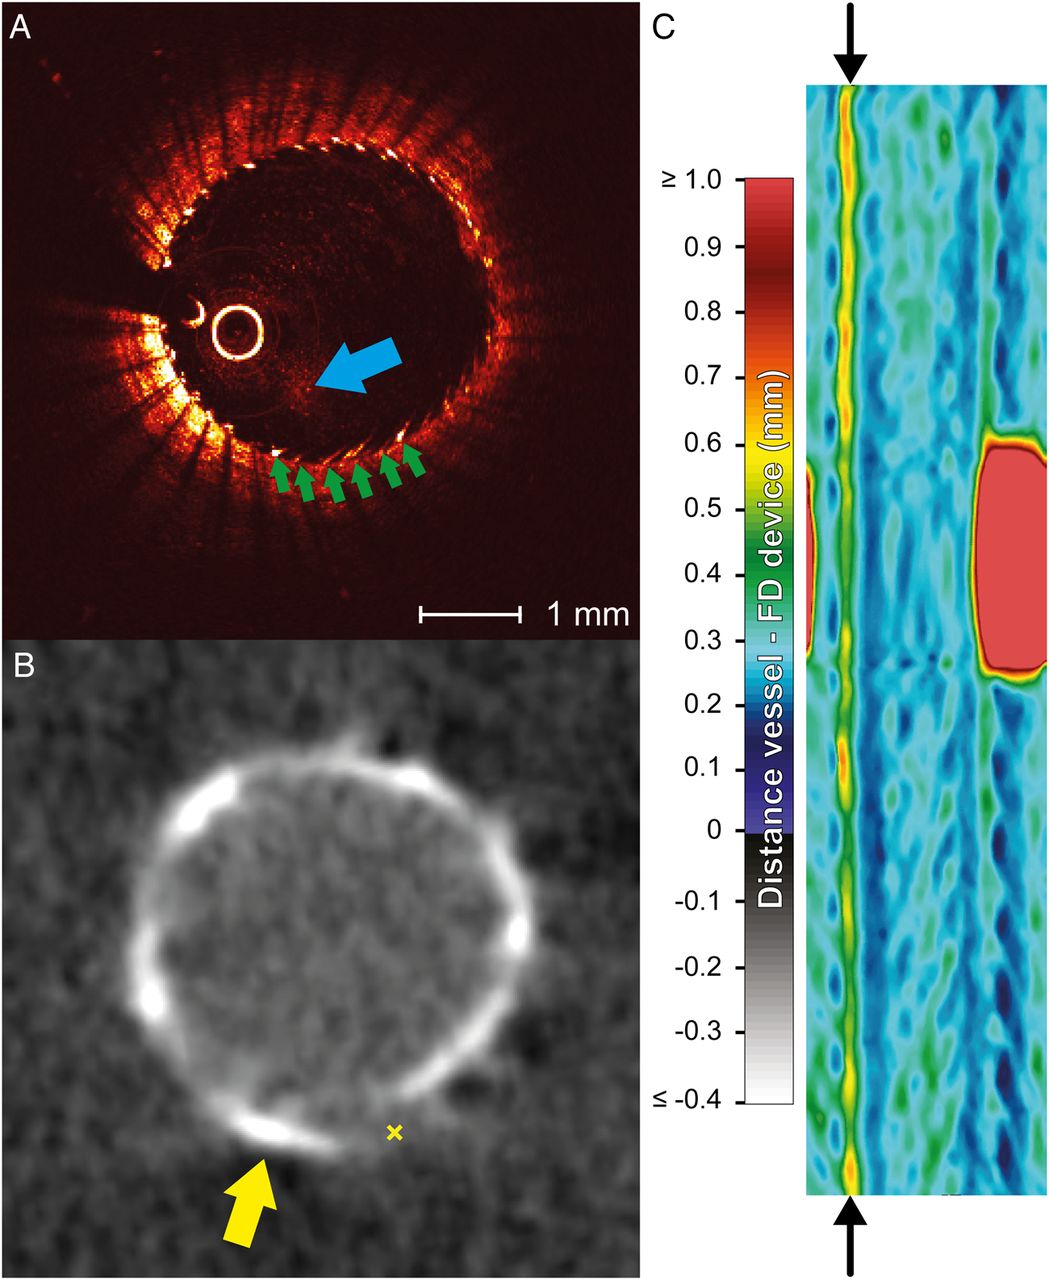
In other samples, local maxima may have been caused by artifacts induced by motion or originating from the metallic properties of the devices. In particular, streak artifacts on the VasoCT images caused some false malapposition detection (figure 3B), although they are easily identified as running along the entire longitudinal direction on the apposition maps (figure 3C).

Metal wires may give rise to imaging artifacts on both modalities, which could adversely affect the device–wall distance measurements. (A) Sunflower artifacts were observed on optical coherence tomography (green lines). In addition, insufficient clearance of the blood (blue arrow) resulted in degraded image quality beyond the blood residue. (B) In a similar fashion, streak artifacts on high-resolution contrast-enhanced cone-beam CT (VasoCT) resulted in suspicious visualization of stent struts (eg, yellow arrow) falsely suggesting malapposition (marked ×). (C) Artificially increased device–wall distances were easily identified on the corresponding VasoCT-based Grading of Regional Apposition after Flow-Diverter Treatment (GRAFT) apposition map, where the arrows point to an elevated apposition measure along the longitudinal axis of the device.
Occasional negative values were observed on the OCT-based apposition maps, indicative of the stent surface penetrating the reconstructed vessel wall. Inspection of the cross-sectional image corresponding to the local minimum indicated in figure 1B suggested that the negative distances originated from a thrombus at the interface between the distal end of the FD device and the side branch (figure 2D) that presented intensity features similar to the vessel wall.
Validation of OCT-based detection of malapposition
To further investigate the performance of GRAFT on intravascular OCT images, we compared its distance measures based on semi-automatic segmentations to those obtained based on manually labeled OCT cross-sections. Overall, 1/11 distance measures obtained from manual segmentations exceeded the predefined threshold of malapposition at 0.25 mm. Logistic regression showed that a threshold of 0.29 mm should be applied on the semi-automatically computed distance measures to achieve 90% accuracy with a sensitivity and specificity of 98% and 81%, respectively. The area under the corresponding ROC curve was 0.96 (figure 4A). An example of the evaluation on a slice that shows moderate malapposition (figure 4A) shows highly similar results obtained from manual (figure 4C) and semi-automatic (figure 4D) segmentations.

Evaluation of semi-automatic malapposition detection based on optical coherence tomography. (A) ROC curve for logistic regression of Grading of Regional Apposition after Flow-Diverter Treatment (GRAFT)-derived median device–wall distances against dichotomized distances at a threshold of 0.25 mm on manually labeled cross-sections. (B) Example slice for which the stent and wall surfaces have been outlined manually. (C) Median distances between flow diverter device and vessel wall determined from manual outlining. (D) Median distances determined from semi-automatic GRAFT analysis.
Discussion
The results obtained with GRAFT indicate that quantitative maps of FD device–wall distances may facilitate screening for potential malapposition and acute thrombus formation, and enrich our understanding of its long-term consequences for aneurysm occlusion and parent vessel remodeling. As an operator-independent measurement tool for quantitative expression of device apposition, GRAFT could reduce inter-observer variation and facilitate apposition-based decision-making during the procedure.
Moreover, in comparison to angiographic VasoCT, we found that intravascular OCT is a promising imaging strategy for enhanced inspection of FD implants. With the introduction of frequency-domain OCT, very rapid acquisition without the need for balloon occlusion can be performed while achieving a spatial resolution of 20–40 μm (lateral) by 15–20 μm (axial)31 for superior intravascular tissue and device visualization.22 Although we could only identify a couple of occasions of malapposition in the present aneurysm model, the quantitative values underlying the apposition maps appeared very similar for VasoCT and OCT. Considering the excellent spatial resolution of intravascular OCT images, nearly all of the stent struts (versus the platinum strands with X-ray based modalities) and the arterial wall could be precisely localized. In particular, we were able to achieve accurate estimates of stent–wall distances for the purpose of malapposition detection beyond 0.25 mm with the use of a semi-automatic post-processing strategy. Another possible advantage of intravascular OCT would be imaging of devices at the skull base, an area which is frequently not imaged well with conventional means.
Treatment of intracranial aneurysms with FDs has been associated with procedure-related morbidity and mortality of 7.4% and 3.8%, respectively, for the Pipeline Embolization Device and 6.0% and 2.7%, respectively, for the Surpass FD.4 ,5 Appropriate perioperative imaging evaluation is therefore vital to assure proper device selection, verify adequate deployment, and identify early signs of complications. Recent studies have demonstrated the benefits of the three-dimensional visualization capabilities of angiographic CT for inspection of FD implant configurations and minimally invasive assessment of aneurysm and in-stent lumen at follow-up.13 ,15 ,32 Building on routinely performed VasoCT acquisitions, post-processing strategies such as GRAFT can further enhance the contribution of advanced imaging in improving treatment safety and efficacy.
Although stroke-related events are well-established complications of FD placement,33 current perioperative dual antiplatelet therapy and imaging resolution may be insufficient to prevent occlusions from small-scale thrombus formation intraoperatively. Nonetheless, maintaining perforator patency is paramount in the posterior circulation.34 Improved positioning of FDs from better image guidance may reduce the need for placing multiple devices and the associated risks of thromboembolic events caused by unintentional high-density metal coverage.34 Moreover, the ability to distinguish individual strands relative to perforating arteries and side branches with intravascular OCT could potentially steer device placement in order to further minimize the risk of perforator infarction.
Several groups have developed computer algorithms tailored to coronary intravascular OCT images to perform tissue characterization,35 lumen segmentation,36 and identification of stent struts for detection of neointimal hyperplasia,37 ,38 quantification of in-stent restenosis,39 ,40 and measurement of vessel wall apposition.41–43 Although materials used to devise coronary and cerebrovascular stents may be similar, FDs are designed with more wires which have a strut thickness in the order of 30 µm compared with the 80–140 µm diameter strands typically used in coronary devices. Understandably, translation of these techniques to the realm of interventional cerebrovascular imaging has been limited so far.44 Our study provides a preliminary endeavor to construct an image classifier that can reliably extract the configuration of the FD device relative to the luminal surface in the intracranial vasculature. Of note, the present FD devices targeted aneurysms that were developed on a fairly straight vessel segment. Since increasingly tortuous geometries may pose additional challenges for both device implants and imaging procedures, further evaluation of the image classifier under more realistic conditions is warranted.
Despite the superior spatial resolution of intravascular OCT, the presence of red blood cells in the field of view severely attenuates the OCT image signal. Because of its high viscosity, a bolus of iodinated contrast was therefore sought to displace the blood22 using an injector or by hand injection. Nonetheless, residual blood was often found to obscure parts of the vessel wall or FD device. Moreover, even when sufficient signal penetration was maintained to see the vessel wall and stent struts, blood residue was difficult to detect on a line-by-line basis. The latter effect may be alleviated by a spatially and temporally extended feature detector. Clearance may additionally be improved in our model with a brief balloon occlusion of the proximal vessel, although this is no longer a necessity as acquisition speeds have markedly improved in second-generation OCT systems. Vessel pulsation was found to cause incidental image distortions and frame misalignments during OCT acquisition, despite fast pullback speeds. Likewise, cardiac and respiratory motion may especially affect the spatial resolution achieved with VasoCT, as images are reconstructed from all projections acquired during a 20 s rotation. The resultant blur of FD device edges may appear like a lumen that extends beyond the device, in effect mimicking poor apposition. This is further exacerbated by residual streak artifacts from the platinum marker wires of the FD device.
Conclusion
We introduced an image post-processing technique that extracts quantitative information on FD apposition to the parent vessel wall from detailed three-dimensional images and evaluated its merits in a canine sidewall aneurysm model on data obtained with VasoCT and intravascular OCT. Our results indicate that candidate locations of malapposition and acute thrombus formation can be conveniently identified and examined with GRAFT. Intravascular OCT holds great promise for delivering high-resolution views of the arterial wall and FD device, although limitations of present-day probes designed for cardiac interventions preclude its straightforward translation to the neuroendovascular territory. We anticipate a new generation of catheter- or wire-based OCT imaging probes that address these issues, while at the same time improving navigability and deliverability to increase compatibility with the intracranial vasculature.
References
Supplementary materials
Supplementary Data
This web only file has been produced by the BMJ Publishing Group from an electronic file supplied by the author(s) and has not been edited for content.
- Data supplement 1 - Online supplement
Footnotes
Contributors KvdM: analyzed and processed the data, performed the experiments, drafted the manuscript. MJG: designed the study, performed the experiments, drafted and revised the manuscript. JPW: performed the experiments, revised the draft manuscript. AMdK: processed the data, revised the draft manuscript. RMK: performed the experiments, revised the draft manuscript. JA: designed the study, revised the draft manuscript. OWB: performed the experiments, revised the draft manuscript. AKW: designed the study, revised the draft manuscript. ASP: designed the study, performed the experiments, revised the draft manuscript.
Funding This work was supported by Stryker Neurovascular and Philips Healthcare.
Disclaimer The content is solely the responsibility of the authors, and does not represent the official views of either Stryker or Philips.
Competing interests MJG: consultation for Stryker Neurovascular, Codman Neurovascular; research grants from eV3/Covidien, Philips Healthcare, NIH, Silk Road, Stryker Neurovascular. AKW: consultation for Stryker Neurovascular; research grants from NIH, Philips Healthcare.
Provenance and peer review Not commissioned; externally peer reviewed.
Data sharing statement For access to the raw images obtained in this study, please contact the corresponding author.