Article Text

Abstract
Background and purpose Infarct volume is a valuable outcome measure in treatment trials of acute ischemic stroke and is strongly associated with functional outcome. Its manual volumetric assessment is, however, too demanding to be implemented in clinical practice.
Objective To assess the value of convolutional neural networks (CNNs) in the automatic segmentation of infarct volume in follow-up CT images in a large population of patients with acute ischemic stroke.
Materials and methods We included CT images of 1026 patients from a large pooling of patients with acute ischemic stroke. A reference standard for the infarct segmentation was generated by manual delineation. We introduce three CNN models for the segmentation of subtle, intermediate, and severe hypodense lesions. The fully automated infarct segmentation was defined as the combination of the results of these three CNNs. The results of the three-CNNs approach were compared with the results from a single CNN approach and with the reference standard segmentations.
Results The median infarct volume was 48 mL (IQR 15–125 mL). Comparison between the volumes of the three-CNNs approach and manually delineated infarct volumes showed excellent agreement, with an intraclass correlation coefficient (ICC) of 0.88. Even better agreement was found for severe and intermediate hypodense infarcts, with ICCs of 0.98 and 0.93, respectively. Although the number of patients used for training in the single CNN approach was much larger, the accuracy of the three-CNNs approach strongly outperformed the single CNN approach, which had an ICC of 0.34.
Conclusion Convolutional neural networks are valuable and accurate in the quantitative assessment of infarct volumes, for both subtle and severe hypodense infarcts in follow-up CT images. Our proposed three-CNNs approach strongly outperforms a more straightforward single CNN approach.
- CT
- stroke
- technique
- thrombectomy
This is an open access article distributed in accordance with the Creative Commons Attribution Non Commercial (CC BY-NC 4.0) license, which permits others to distribute, remix, adapt, build upon this work non-commercially, and license their derivative works on different terms, provided the original work is properly cited, appropriate credit is given, any changes made indicated, and the use is non-commercial. See: http://creativecommons.org/licenses/by-nc/4.0/.
Statistics from Altmetric.com
Introduction
Measuring the volume of infarcts on non-contrast computed tomography (NCCT) scans provides a quantitative assessment of infarcted brain tissue resulting from ischemic stroke. Follow-up infarct volume measured after 24 hours from onset1 is a valuable predictor of functional outcome. Infarct volume has been suggested as a surrogate endpoint for classic patient outcome scales in multiple randomized controlled trials.2 By combining infarct volume with infarct location, a more precise prediction of patient outcome can be achieved.3
The reference standard for infarct segmentation is manual delineation by medical experts. However, manual delineation has several disadvantages as it is time-demanding, subjective, prone to errors, and costly.4 Accordingly, manual delineation does not work well in large cohort studies.
Convolutional neural networks (CNNs) have outperformed many existing image analysis methods for image classification and image segmentation. CNNs have produced good segmentation results in multiple medical imaging domains, including segmentation of ischemic stroke lesions in magnetic resonance images of the brain.5–7 In this study, we evaluated the usefulness of CNNs for automatic segmentation of infarcted brain tissue in follow-up NCCT scans from patients with an acute ischemic stroke.
Materials and methods
Image data
We used anonymized image data from the HERMES collaboration.8 This collaboration combined clinical and image data from seven clinical trials that investigated the efficacy of endovascular therapy in patients with acute ischemic stroke. Central medical ethics committees and research boards of each participating hospital approved each trial and the use of anonymized image data in this retrospective study. All patients, or their legal representatives, provided written informed consent.
We used image data only from patients with follow-up NCCT acquired between 12 hours and 2 weeks after stroke onset and for whom a reference infarct segmentation was available. A total of 1026 patients had follow-up NCCT imaging acquired within the selected time window and with an available reference segmentation. Thin-slice image data were reconstructed into scans with 5 mm slice thickness.
Reference segmentations
The reference infarct segmentation on the follow-up NCCT scans was manually delineated by one of two experienced observers, as described by Boers et al.9 In short, infarcts were identified as hypodense areas. Infarcted tissue in the ipsilateral hemisphere with characteristics of an old infarct were excluded from the reference segmentation. NCCT scans of patients who underwent decompressive hemicraniectomy were excluded. Parenchymal hemorrhages within or adjacent to the infarcted area were included in the reference segmentation. A standard window width of 30 Hounsfield units (HU) and center level of 35 HU were used to limit variation between observers. If multiple follow-up images were available, reference segmentation was performed in the latest acquired scan. The manual segmentations were checked by one of three expert radiologists and, when necessary, corrections were made.
Preprocessing
To exclude trivial voxels that were of no interest, such as air or skull, we used automatic methods for intracranial region and cerebrospinal fluid (CSF) segmentation. First, we excluded all voxels outside the brain using an intracranial region segmentation. Subsequently, we also discarded all voxels selected by the CSF segmentation. All discarded voxels were neither used to train the CNN nor used for accuracy testing of the CNN.
The intracranial region segmentation uses the size range of the foramina of the skull, as reported by Berge et al,10 and typical HU values of the skull. This segmentation was performed according to the following steps:
A threshold-based segmentation was performed to segment bones. We considered everything with intensity >160 HU as bone.
A morphological dilatation with a 7 mm radius was used to close all foramina of the skull except the foramen magnum.
The center of gravity of the segmented bone was used as a seed for a region growing inside the skull.
A morphological dilatation with a 7 mm radius was applied to the region growing result to bring the segmented intracranial region close to the skull border.
The foramen magnum was detected by evaluation of the segmented area in each individual slice from top to bottom. The foramen magnum slice was determined as the first slice with a segmented area <900 mm² after the slice with the maximum segmented area. All voxels below the foramen magnum slice were excluded from the segmentation.
The CSF segmentation was performed by selecting the voxels around the centroid of the segmented intracranial region as seeds for region growing. All voxels within a maximum distance of 15 mm from this centroid and with density values between −5 and 13 HU were used as seeds. The lower and upper thresholds of this region growing were also −5 and 13 HU.
We used a previously presented method for automated intracranial hemorrhage segmentation11 to exclude the parenchymal hemorrhages of the CNN-based infarct segmentation. These hemorrhage voxels were not used to train the CNN. However, for infarct volume accuracy testing, any area that was classified as hemorrhage was added to the infarct segmentation.
CNN-based infarct segmentation
The CNN architecture used in this study was developed in-house. Its hyperparameters were optimized for segmentation of a single foreground structure in head NCCT scans, which in this case was the infarcted brain tissue. Previously, the same CNN architecture was successfully used for intracranial hemorrhage segmentation.11 This CNN architecture determines the probability of the voxel at the center of an image patch being foreground (infarcted tissue) or background (any other tissue). This probability was subsequently dichotomized using a cut-off value, which was optimized with the data in the validation set.
The CNN architecture has two convolutional layers followed by two fully connected dense layers. Each dense layer has 256 nodes. The size of the input patch was 19×19×3 voxels; 19×19 voxels in the axial plane and three slices high. Each slice of the input patch was processed as a different image channel. After each convolutional layer, there is a max-polling layer with a 2×2 kernel and a 2×2 stride. The first convolutional layer has 64 feature maps and the second has 128 feature maps. Both convolutional layers have kernels with size 5×5.
The hypodensity of the infarcted tissue in NCCT scans is related to breakdown of cells and its fluid content. As shown in figure 1, the infarcted areas in the three NCCT scans have different HU values. In figure 1, we also show the distribution of the average HU values of the infarct reference segmentations. In our population, the HU value distribution depicted three peaks, which we named subtle, intermediate, and severe hypodense infarcts. Because of this observation, we trained three CNNs. Each of these CNNs was trained to classify a different hypodensity distribution of infarcted brain tissue. We grouped all patients according to the hypodensity of the delineated infarct. We used the average HU value of the infarction for this grouping. The average infarct intensity was computed after excluding the hemorrhage voxels of the reference segmentation. The thresholds that define each infarction class were (14, 22) HU for severe, (22, 32) HU for intermediate, and (32, 44) HU for subtle.

Histogram of average infarct intensities of the manually delineated infarcts. The left CT image at the top displays a relatively old infarct with a severe hypodensity; in the middle, an intermediate old infarct is shown; and the image on the right shows a relatively young infarct with a subtle hypodensity.
We used 570 randomly selected scans to train the three CNNs. We augmented the number of training infarct patches by flipping along the sagittal plane and by rotation. No data augmentation was applied to the non-infarct patches. We used an additional 60 scans to optimize the cut-off value for generating binary segmentations, 20 scans for each CNN. The union of the results of these three CNNs and the result of the intracranial hemorrhage segmentation was considered to be the automated generated infarct segmentation. The remaining 396 scans were used to test segmentation performance.
For comparison, we also trained a single CNN architecture for the segmentation of all types of infarction. The same methodology and data were used for this single CNN approach and the three-CNNs approach.
We used the Dice coefficient as an accuracy measure of the infarct segmentation performance in the test set. We calculated the intraclass correlation coefficients (ICCs) to compare the reference and the automatically generated infarct volumes. ICCs were interpreted according to the American Psychological Association al 12 : <0.4 is poor; ≥0.4 to <0.6 is fair, ≥0.6 to <0.75 is good, and ≥0.75 is excellent. We opted not to compare our approach with U-Net or Mask R-CNN architectures. Both these architectures are more extensive than the proposed architecture and, in a straightforward approach, their input would be an entire NCCT slice. Since we used 5 mm reconstructions, and not all slices from a NCCT scan have infarction, we did not expect a satisfactory segmentation given the limited number of NCCT slices with infarcted brain tissue that would be used as training samples.
Results
The median infarct volume was 48 (IQR 15–125) mL overall, with 29 (IQR 11–86), 46 (IQR 18–101), and 89 (IQR 35–210) mL for patients with a subtle, intermediate, and severe hypodense infarct, respectively.
The comparison between manually delineated infarct volumes and the volumes from the three-CNNs approach showed an excellent agreement with an ICC of 0.88. Even better agreement was observed for severe and intermediate hypodense infarcts with ICCs of 0.98 and 0.93, respectively. Agreement was good for subtle hypodense infarcts, with an ICC of 0.66. In figure 2, the agreement between the infarct volumes is shown. Agreement of the single CNN approach was poor, with an ICC of 0.34.

Top: Comparison of the infarct volume of the results from the three-CNNs approach (y axis) with the reference to infarct volume (x axis). Bottom: Bland-Altman plots of the infarct volumes. The difference in the volume determination is given along the y axis, and the average of the automated and reference infarct volume is depicted along the x axis. The different columns show separate severe, intermediate, and subtle hypodensity infarcts.
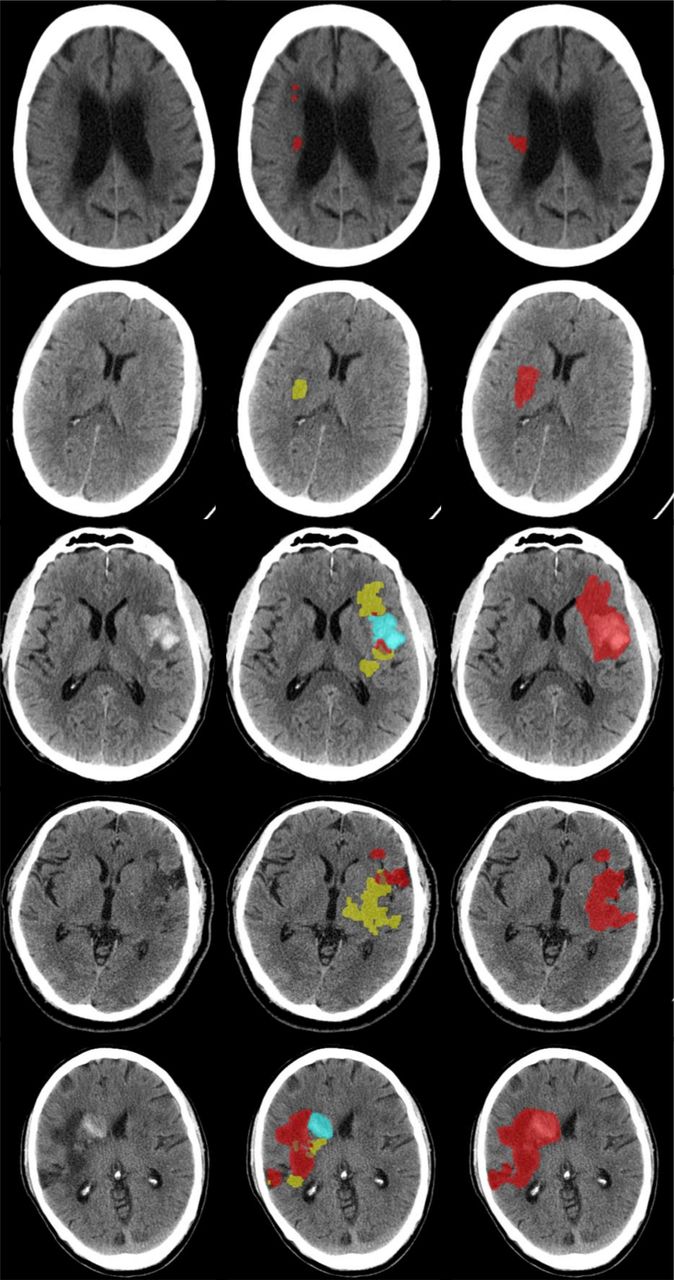
The average Dice coefficient achieved by the three-CNNs approach was 0.57±0.26. The average Dice coefficients for each category were 0.78±0.09, 0.61±0.21, and 0.37±0.26, for the severe, intermediate, and subtle hypodense infarcts, respectively. The method based on a single CNN achieved an average Dice coefficient of 0.18±0.23. Table 1 shows a summary of the segmentation performance measures. In figure 3, we show some sample results from the three-CNNs approach.
Sample results. from left to right we have input image, union of the segmentation results, and reference segmentation. For simplicity, in the center column we rendered the hemorrhages (blue) over the subtle infarcts (yellow), subtle infarcts over standard infarcts (orange), and standard infarcts over severe infarcts (red). The Dice coefficients from top to bottom were 0.10, 0.26, 0.40, 0.55, and 0.70. In the left colum the original images are shown. The right shows the merged segmentations.
Results of automated infarct segmentation for severe, intermediate, and subtle hypodense infarcts and the average over the whole test dataset for the three-CNNs approach. for comparison with the accuracy of the single CNN approach
Discussion
We have shown that CNNs are valuable in the automated cerebral infarct segmentation in follow-up CT images of patients with acute ischemic stroke, with excellent agreement with volumetric assessments of expert observers. Owing to the wide variety of the severity of hypodensities, we proposed using the combination of three CNNs, which strongly outperformed a single CNN approach.
Infarct location and infarct volume have been strongly associated with outcome of patients with ischemic stroke in several studies.3 13 Reliably segmenting cerebral infarcts is challenging because of pathophysiological heterogeneity, presence of pre-existing pathologies such as old infarcts, leukoaraiosis, atrophy, intrinsic differences in attenuation of grey and white matter, and hemorrhagic transformation. Thus, to be able to develop robust automated methods for cerebral infarct segmentation, heterogeneous image data are required. The proposed method was evaluated in a large cohort of patients from seven multicenter randomized trials enrolling in multiple countries. The follow-up NCCT scans used in our study also had a (pragmatically) wide range of follow-up time after stroke onset, ranging from 12 hours to 2 weeks. Despite these variations, the proposed approach based on three different CNNs produced accurate cerebral infarct segmentations. The volume of these segmentations had good or excellent correlation with the reference infarct volume. We have shown that accuracy for old, severe hypodense infarcts was higher than for subtle hypodense infarcts. Note that, although we presented the results in a selective manner, exactly the same procedure was applied for the infarct segmentations in all the three different infarct categories.
A number of previous studies on automatic infarct core segmentation in various image modalities have been presented. Multiple CNN-based techniques have been introduced recently. On baseline CT perfusion, state-of-the-art infarct segmentation was obtained by a CNN architecture proposed by Liu et al,14 achieving an average Dice coefficient of 0.51±0.31. On MRI the CNN architecture proposed by Kamnitsas et al 6 reported an average Dice coefficient of 0.66±0.24. Maier et al 7 tested several methods with different types of MR images. Their best reported result was achieved by a CNN with an average Dice coefficient of 0.73±0.18. The current state-of-the-art method for infarct segmentation on MR images is the CNN proposed by Zhang et al,5 which achieved an average Dice coefficient of 0.79 in a test set with 90 images. Although good segmentation results were achieved in CT perfusion and MR images, NCCT scans are still the predominant method for assessment of follow-up infarct in patients with ischemic stroke. Therefore, we focused on using NCCT as input for the proposed cerebral infarct segmentation method.
On NCCT scans, two semiautomated methods are available for infarct segmentation. The semiautomated method by Bardera et al 15 was evaluated with 18 patients and reported a Pearson’s correlation coefficient of 0.98 and 0.97 compared with the manual segmentations from two different observers. The semiautomated method by Kuang et al 16 was evaluated with 16 patients and reported an average Dice coefficient of 0.76±0.10. By contrast, our method is both fully automated, which avoids the variability introduced by the user inputs, and has been tested on a far larger number of patients.
Other fully automated methods for infarct segmentation on NCCT are available. The method by Boers et al 17 reported an average Dice coefficient of 0.74±0.13 in a test set with 34 images. The average onset to follow-up scanning time in the study by Boers et al was 4.1±2.3 days. The average Dice coefficient between human observers in the study by Boers et al was 0.84 ranging from 0.63 to 0.94, which was somewhat higher than the agreement we achieved. However, it should be noted that the manual delineation was performed for old, hypodense infarcts only. The method by Vos et al 18 reported an average Dice coefficient of 0.74±0.09 in a test set with 30 images. In the study by Vos et al, the average time between onset and scan acquisition was 3 days ranging between 2 and 5 days. More recently, the method by Gillebert et al 19 was evaluated with 12 patients with ischemic stroke and reported Dice coefficients ranging from 0.27 to 0.71. The scans used to evaluate the method by Gillebert et al had an average acquisition time after onset of 40 hours. Their method was evaluated in a limited set of selected images to illustrate different types of ischemic stroke lesions. In contrast with the methods of Boers et al, Vos et al, and Gillebert et al, our method has been thoroughly evaluated with a large and diverse test set.
The data used in our study included follow-up scans as early as 12 hours after stroke onset. Infarcts in these early follow-up scans might be subtle and harder to segment. Thus, it was expected that our method would achieve a lower accuracy in such scans. Moreover, the manual delineation in these scans is more difficult, resulting in more variation among experts. This may also strongly contribute to the lower agreement of the automated method with the reference standard. It some cases (also in figure 3), the network in charge of segmenting subtle infarcts overestimates the infarct region by including subtle hypodense areas which are not part of the infarction. Another common source of misclassifications by our proposed method is the inclusion of cerebral sulci in the results of the network trained to segment severe infarctions (figure 3).
A major limitation is the highly selective nature of the HERMES population. All patients had anterior circulation stroke confirmed by CT angiography, mostly within 6 hours of onset. Patients were excluded from most studies if they had prior disability or low Alberta Stroke Program Early CT scores. As a result, many of the background abnormalities typical in populations with acute stroke were less prevalent in our population. Moreover, average age was around 69, and very elderly patients were under-represented. Despite variation among study populations, these still represent a much more homogeneous group than patients with stroke as a whole.
Overall, the proposed method achieved an excellent correlation with the reference infarct volume. This suggests that our method can be used in clinical trials, replacing tedious manual delineations. Its value in functional outcome prediction for patients with ischemic stroke and its value as a secondary outcome measure in treatment trials still has to be established.
Footnotes
Twitter @mihill68
Contributors All authors have made a substantial contribution to all categories established by the ICMJE guidelines on authorship.
Funding This study was funded by ITEA3 (grant number: 10004).
Competing interests RSB, AMMB, HAM, and CBLMM are cofounders and shareholder of Nico Laboratory. EP is a shareholder of Nico Laboratory.
Patient consent for publication Not required.
Provenance and peer review Not commissioned; externally peer reviewed.
Data availability statement Data are available upon reasonable request.