Article Text

Abstract
Purpose Coil embolization is a minimally invasive method used to treat cerebral aneurysms. Although this endovascular treatment has a high success rate, aneurysmal re-treatment due to recanalization remains a major problem of this method. The purpose of this study was to determine a combined parameter that can be useful for predicting aneurysmal re-treatment due to recanalization.
Methods Patient-specific geometries were used to retrospectively analyze the blood flow for 26 re-treated and 74 non-retreated aneurysms. Post-operatively aneurysms were evaluated at 12-month follow-up. The hemodynamic differences between the re-treatment and non-retreatment aneurysms were analyzed before and after coil embolization using computation fluid dynamics. Basic fluid characteristics, rates of change, morphological factors of aneurysms and patient-specific clinical information were examined. Multivariable analysis and logistic regression analysis were performed to determine a combined parameter—re-treatment predictor (RP).
Results Among examined hemodynamic, morphological, and clinical parameters, slight reduction of blood flow velocity rate in the aneurysm, slight increase of pressure rate at the aneurysmal neck and neck area, and hypertension were the main factors contributing to re-treatment. Notably, hemodynamic parameters between re-treatment and non-retreatment groups before embolization were similar: however, we observed significant differences between the groups in the post-embolization average velocity and the rate of reduction in this velocity in the aneurysmal dome.
Conclusions The combined parameter, RP, which takes into consideration hemodynamic, morphological, and clinical parameters, accurately predicts aneurysm re-treatment. Calculation of RP before embolization may be able to predict the aneurysms that will require re-treatment.
- aneurysm
- blood flow
- coil
This is an open access article distributed in accordance with the Creative Commons Attribution Non Commercial (CC BY-NC 4.0) license, which permits others to distribute, remix, adapt, build upon this work non-commercially, and license their derivative works on different terms, provided the original work is properly cited and the use is non-commercial. See: http://creativecommons.org/licenses/by-nc/4.0/
Statistics from Altmetric.com
Introduction
Although coil embolization is superior compared with surgical clipping when considering the physical burden on patients, aneurysmal recanalization and re-treatment remain major problems for this method.1–6 In previous studies, recanalization was observed during follow-up in approximately 10% to 25% of coil-embolized aneurysms.7 8 Many attempts have been made to overcome the drawbacks of coil embolization, including the development of parameters that can help predict recanalization or re-treatment. One of these, the volume embolization ratio (VER) or packing density, is the most popular metric for predicting aneurysmal recanalization since it is thought that a high VER indicates sufficient reduction in the blood velocity in an aneurysm.9 10 However, successful treatment with a low VER and recanalization with a high VER have been reported.11 Therefore, hemodynamics after coil embolization is thought to be the main contributing factor.12
Investigating the hemodynamics before and after coil embolization will help us understand the mechanism of recanalization, and computational fluid dynamics (CFD) might become a valuable tool for predicting recanalization.12–14 Sugiyama et al used patient-specific geometries of the pre-treated cerebral artery to analyze the blood flow and retrospectively investigated the relationships between hemodynamics and recanalization.15 Another report focused on the post-treatment hemodynamics of an aneurysm that underwent recanalization.16 While these results suggest that the difference between recanalization and non-recanalization is related to hemodynamic factors, these previous studies did not differentiate between the types of endovascular treatment. Although the blood flow characteristics of a coiled aneurysm and a stent-assisted coiled aneurysm differed, that is, the impingement jet was weaker after stent-assisted coiling,17 aneurysms treated with stent-assisted techniques were not separated from those treated only with coils in the previous studies. To the best of our knowledge, only 86 cases of coiled aneurysms have been analyzed using CFD,18 making the research on the subject difficult. Moreover, changes in flow after embolization have not been well investigated using patient-specific embolization coils. Furthermore, no studies have reported re-treatment predictors using a combined parameter considering hemodynamic, morphological, and clinical parameters, although these parameters have been reported as risk factors for aneurysmal retreatment due to recanalization.
In the present study, we characterized the pre- and post-embolization hemodynamics of aneurysms using CFD. Patient-specific geometries were used to retrospectively analyze the blood flow for a total of 100 aneurysms, including 26 requiring and 74 not requiring re-treatment aneurysms. We investigated the basic fluid characteristics (ie, blood velocity, pressure, and mass flow) and their rates of change. We also investigated patient-specific clinical information and morphological factors. We then performed multivariable analysis and logistic regression analysis to determine a combined parameter that would be useful for predicting the need for aneurysmal re-treatment. This is the first study to investigate a combined parameter that can be useful for predicting aneurysmal re-treatment due to recanalization.
Material and methods
Patient selection and clinical data
Three-dimensional digital subtraction angiography (3D-DSA) was performed for all patients who received endovascular treatment for aneurysms at Jikei University School of Medicine, and the imaging data were stored in a database. Each patient was followed up for 12 months after the first embolization. The target aneurysms were saccular type, unruptured, and coil-treated during the 9 years from 2006 to 2015. We identified 1056 aneurysms in 1002 patients, including 75 aneurysms in 73 patients that required re-treatment. The aneurysmal sites varied, but included the internal carotid artery (ICA), middle cerebral artery (MCA), anterior cerebral artery (ACA), and vertebral and basilar arteries (VABA). In this study, re-treatment aneurysms were defined as those that required re-operation because recanalization was diagnosed during the 12-month follow-up period. In contrast, non-retreatment aneurysms were defined as aneurysms that remained stable during the same period, as diagnosed using magnetic resonance angiography (MRA) and MRI. Two blinded neurosurgeons each reviewed the latest 200 cases in a retrospective manner. Due to the major existing concern on the quality of rough angiographic data that makes them suitable for CFD processing and analysis, in addition to having the standard indications for treatment, the neurosurgeons selected patients that will render good quality CFD data (ie, excluding cases where main arteries were not connected to each other, or those with high noise levels due to artifacts). Stent-assisted coil treatment was also excluded during the review. Independently matching the selection of the two neurosurgeons, we listed the latest 100 of that match. Within these we found 26 re-treatment aneurysms and 74 non-retreatment aneurysms. All patient data contained the sex of the patient, history of alcohol consumption, presence of bleb, diabetes mellitus (DM), hypertension (HT), hyperlipidemia, and family history of subarachnoid hemorrhage (SAH).
CFD analysis
The three-dimensional data of the patients’ artery and embolization coils were converted to stereolithography (STL) data using 3D visualization software, Amira 5.6 (FEI Company, Hillsboro, OR, USA). The residual space within the coil bulk was filled manually to assume complete embolization. The pulsation of the average mass-flow rates at the ICA and VA measured from healthy adults by Ford et al were used in the present study.19 The detailed method for the CFD analysis is included in the online supplementary data.
Supplementary file 1
Hemodynamic parameters
To evaluate the flow difference between re-treatment and non-retreatment aneurysms, we defined some parameters related to basic flow characteristics (ie, velocity, pressure, and mass flow). The blood velocity in the aneurysm was defined as the average velocity in the aneurysmal dome (Ane.V*). We also calculated the maximum velocity in the aneurysmal dome (Ane.VMax*). In the same way, the velocity at the aneurysmal neck was defined as the average inflow velocity at the neck surface (NeckVIn*). We also calculated the maximum inflow velocity (NeckVInMax*). The mass flow into the aneurysm through the aneurysmal neck was defined as NeckMF. All parameters based on velocity and mass flow were normalized using the average velocity and mass flow at the inlet of the parent artery, as defined in our previous study.20
A pressure difference (PD) was applied to observe the role of pressure in aneurysmal re-treatment.21 We defined the average PD at the aneurysmal neck (NeckPD), the maximum PD at the aneurysmal neck (NeckPDMax), the average PD at the surface of the embolization coil (CoilPD), and the maximum PD at the surface of the embolization coil (CoilPDMax). The detailed method for the PD is included in the online supplementary data.
Statistical methods
All statistical analyses were performed using SAS 9.4 (SAS Institute, Inc., Cary, NC, USA). The Mann–Whitney U-test was used if either group did not exhibit normal distribution. If both groups showed normal distribution, Student’s t-test or Welch’s t-test was used according to the presence or not of equal variance respectively. Univariate and multivariable logistic analysis were also performed. We finally defined the combined parameter using logistic regression analysis for the selected variables. The detailed method for the statistical analysis is included in the online supplementary data.
Results
Hemodynamic characteristics of re-treatment and non-retreatment aneurysms
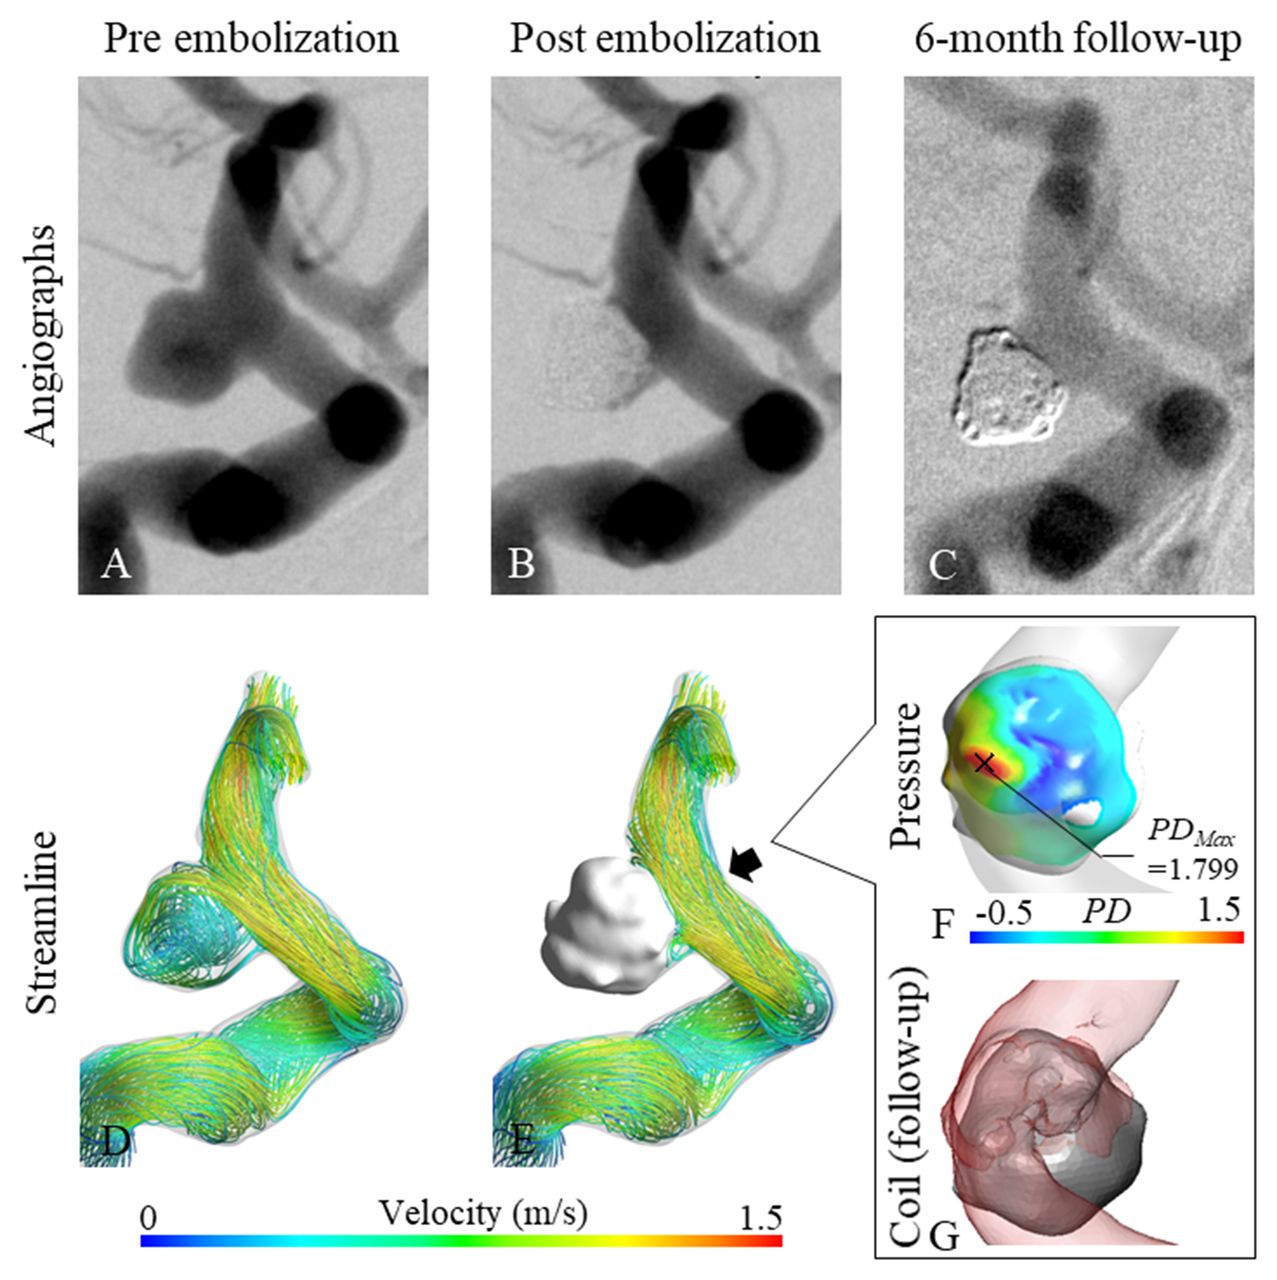
Illustrative cases of re-treatment and non-retreatment ICA aneurysms are shown in figures 1 and 2, respectively. It was confirmed from the CFD results that the embolization coil blocked the flow of blood into the aneurysms at the aneurysmal neck and distributed the pressure at the coil near the aneurysmal neck in both cases, as shown in figures 1 (F) and 2 (F). In the re-treatment aneurysm, aneurysmal recanalization occurred from the inflow zone due to coil compaction: the orange PD area in figure 1 (F) corresponds to the recanalized area shown in figure 1 (G). In contrast, no recanalization was confirmed in the non-retreatment aneurysm from the red PD area at the coil surface (see figure 2 (F) and (G)). Although the maximum PD value for non-retreatment (PD=1.799) is higher than that for re-treatment (PD=1.456), the inserted coil at the aneurysmal neck in the non-retreatment aneurysm still prevented the inflow of blood.

Illustrative case of re-treatment aneurysm. (A–C) Angiographic image at pre-, post-embolization, and 6-month follow-up. (D, E) Streamline at pre- and post-embolization. (F) Pressure distribution on coils from the view of the black arrow. The cross mark is the point of maximum PD. (G) Coil after follow-up looked in the direction of the black arrow. (The silver mass is the coil and transparent red is blood.)
Illustrative case of non-retreatment aneurysm. (A–C) Angiographic image at pre-, post-embolization, and 6-month follow-up. (D, E) Streamline at pre-and post-embolization. (F) Pressure distribution on coils looked in the direction of the black arrow. The cross mark is the point of maximum PD. (G) Coil after follow-up from the view of the black arrow. (The silver mass is the coil and transparent red is blood.)
Fisher’s exact test for clinical data
Clinical parameters including aneurysmal location for 100 patients were analyzed using Fisher’s exact test, as shown in online supplementary table S1. Aneurysm locations were divided into four areas: ICA, MCA, ACA, and VABA. Our results showed that, like sex, history of alcohol consumption, presence of bleb, hyperlipidemia, and family history of SAH, the location was not associated with aneurysmal re-treatment. In contrast, there was a significant difference in HT between the re-treatment and non-retreatment groups (P=0.0418). This result indicates that patients with HT had higher probability to require aneurysmal re-treatment.
Parametric or nonparametric tests for hemodynamic and morphological data
The Mann–Whitney U-test or Student’s t-test was used to analyze all hemodynamic or morphological parameters, as shown in online supplementary table S2. From the hemodynamic parameters, only aneurysm velocity (Ane.V*) was significantly different: the P value for Ane.V* after embolization and that for the Ane.V* reduction rate before and after embolization were 0.036 and 0.034, respectively. The velocity in re-treatment aneurysms was significantly higher after embolization than that of non-retreatment aneurysms (0.017±0.023 and 0.008±0.013, respectively). Moreover, velocity reduction rate in re-treatment aneurysms was significantly lower than that of non-retreatment aneurysms (0.962±0.049 and 0.982±0.029, respectively). In contrast, VER was significantly lower in re-treatment aneurysms (21.5%±0.047% in re-treatment aneurysms and 23.8%±0.051% in non-retreatment aneurysms; P=0.049). There were no differences in the other morphological parameters (aneurysm volume and neck area) between the groups.
Logistic analysis for clinical data and hemodynamics
Univariate logistic analysis was performed to analyze all hemodynamic, morphological, and clinical parameters between the re-treatment and non-retreatment groups, as shown in online supplementary table S3. Firth’s bias-adjusted estimates were performed for ‘History of alcohol consumption’, ‘DM’, and ‘Family history of SAH’ since the sample size for them was less than 10. Nine parameters had P values less than 0.1, and four parameters showed significant differences. The VIFs of the variables were also obtained, and all VIFs were less than 10. Multivariable logistic analysis and stepwise selection using the P value were performed for the nine parameters, as shown in table 1. Finally, the Ane.V* reduction rate, NeckPDMax increase rate, neck area, HT, and sex were chosen from all the variables. Although two-way interaction terms were considered, no interaction terms were detected, having the P value less than 0.05. Among these parameters, the Ane.V* reduction rate was the most effective factor for indicating re-treatment, having the lowest P value (P=0.005). In addition, the result of Hosmer–Lemeshow goodness-of-fit test for the final model indicated that the P value was 0.231. We compared the predictive probability of a normal model and leave-one-out (100-fold) cross-validation model. As a result, the correlation coefficient was 0.989, which indicated the validity of the final model.
Results of multivariable logistic analysis
ROC analysis for the combined parameter
To predict aneurysmal recanalization, we developed a new combined parameter, re-treatment predictor (RP), using logistic regression analysis as follows:22

ROC analysis was performed for RP to obtain a cut-off value, as shown in figure 3. The specificity and sensitivity at the cut-off point (RP=0.218) were 0.716 and 0.885, respectively. The area under the curve (AUC) was 0.833. Although the Ane.V* reduction rate between the groups was significantly different according to the Mann–Whitney U-test (P=0.034) and was the most effective factor for indicating the re-treatment among the proposed variables (P=0.005 using multivariable logistic analysis), the result of the ROC analysis for the Ane.V* reduction rate was inferior to that for RP: the specificity and sensitivity at the cut-off point were 0.581 and 0.654, respectively (AUC=0.640). ROC analysis of VER, which was a significantly different morphological parameter between the groups, showed a specificity and sensitivity of 0.784 and 0.500, respectively (AUC=0.631), at the cut-off point (VER=20.2%). ROC contrast also showed the significance of RP compared with Ane.V* reduction rate (P=0.001) and VER (P=0.011), respectively.

ROC analysis of RP; Ane.V* reduction rate, and VER
Discussion
Hemodynamic, morphological, and clinical differences between recanalized and non-recanalized cases
The hemodynamics in recanalized aneurysms have been studied using CFD, revealing some relationships between blood flow and recanalization.15 16 The results from the Mann–Whitney U-test or Student’s t-test in the present study also indicated hemodynamic differences between re-treatment and non-retreatment groups (see table 1): post-embolization Ane.V* and the Ane.V* reduction rate were also significantly different. On the other hand, although a previous report showed that the inflow rate at the aneurysmal neck was significantly higher in recanalized aneurysms before embolization,15 our study showed no significant difference in the same parameter (NeckMF) at all stages (pre- and post-embolization, and change in rate). Although there was a tendency for re-treatment aneurysms to be larger than non-retreatment aneurysms, there was no statistically significant difference between the groups (P=0.543), and we suppose that it can be the possible reason for not having differences in the NeckMF (before and after treatment). In a previous study, the recanalized aneurysms were significantly larger than the non-recanalized, so it is highly possible that the size of aneurysms affects hemodynamics, which exhibited significant differences in the CFD analysis.15 18 Notably, our study showed significant differences in hemodynamic parameters between re-treatment and non-retreatment groups for aneurysms of similar size. Moreover, an important point of our study is that there were no differences in the hemodynamics between re-treatment and non-retreatment groups before embolization. This result implies that re-treatment is not affected by hemodynamic characteristics before embolization when aneurysm size is similar. In other words, the effectiveness of coil embolization, i.e., whether or not the aneurysms may require re-treatment due to recanalization, depends on the distribution of coils in the aneurysms (eg, the distribution of coils mainly in the neck).
For the clinical parameters, there were no significant differences among the aneurysmal locations (ICA, MCA, ACA, and VABA). Thus, we performed statistical tests without dividing the results based on the aneurysmal location. Significant differences in HT were observed between re-treatment and non-retreatment groups, which suggests that patients with HT are more likely to require aneurysmal re-treatment. This makes intuitive sense, since recanalization is thought to take place, in part, due to hemodynamic stress, such as an increase in blood velocity.
Some clinical reports have suggested that a high VER will prevent aneurysmal recanalization because the purpose of coil embolization is to block the flow of blood into the aneurysm with inserted coils. In a previous study, VER was significantly different between recanalized aneurysms and non-recanalized aneurysms, and ROC analysis showed that a VER exceeding 19.2% carries a low risk of recanalization.23 Our results also indicated a significant difference in VER, and the cut-off value (20.2%) is similar to that of the previous report. However, VER is a morphological parameter that does not take into consideration hemodynamic effects. A more accurate parameter to predict re-treatment due to recanalization should also consider hemodynamic and clinical effects.
Prediction of aneurysmal recanalization
The inflow rate as a predictor for recanalization after coil embolization in basilar tip aneurysms has been considered,15 however, as we mentioned above, this previous study did not consider differences in aneurysmal size. Moreover, previous studies statistically analyzed hemodynamic, morphological, and clinical parameters independently. An effective predictor of aneurysmal re-treatment should consider a combination of hemodynamic, morphological, and clinical parameters. Therefore, the present study introduced a combined parameter, RP. As shown in figure 3, aneurysmal re-treatment can be predicted more accurately using the cut-off value of RP than that of the Ane.V* reduction rate or VER.
Additionally, RP implies that male patients with wide-neck aneurysms with low reduction of Ane.V* and low increase of NeckPD are more likely to have an aneurysm that requires re-treatment. In other words, aneurysms requiring re-treatment may result from deficient thrombus formation due to an insufficient reduction in blood inflow velocity after embolization. The slight increase in NeckPD is probably because the inflow at the aneurysmal neck was not well embolized (ie, the coils did not block the inflow). In actual clinical settings, a large reduction in Ane.V* and increase in NeckPD might be possible by inserting the coils mainly at the inflow zone of the neck.
Limitations
There are some limitations regarding CFD analysis of blood flow, including the use of a rigid artery wall, Newtonian blood model, and non-patient-specific flow boundary conditions. However, these methods have been reported as useful ways for understanding the hemodynamic characteristics in an aneurysm.20 24 25 Liang et al reported that blood flow is stabilized in response to transmural pressure change in resistance vessels by autoregulation.26 In addition, the result of CFD and patient information, including hypertension, were considered as independent factors in statistical methods.
The geometry of the patient-specific embolization coils was generated using DICOM data obtained from the results of DSA. To analyze the flow after coil embolization, the DICOM data of the coil were merged with data of the untreated aneurysm by adjusting the position after embolization to that before embolization. Thus, the post-embolization analysis may contain metal artifacts and partial volume effects. Moreover, blood flow through the space between the coils was not simulated since the lumen of the embolization coil was filled manually to assume complete embolization. Although the flow after coil embolization may not reflect the exact conditions because of these limitations, it is a reasonable simplification of a thrombosed coil. For a similar reason, the effect of coil distribution was not considered. Further research on the effect of using a realistic simulation of coil embolization by structural analysis is needed.12
Only 100 aneurysms, including re-treatment and non-retreatment aneurysms, were analyzed in the present study. To enhance the accuracy of the combined parameter, RP, we will need to increase the number of analyzed cases. The retrospective nature of the study is also a limitation. A prospective study on preventing aneurysmal re-treatment will be needed.
Conclusion
We investigated the hemodynamic differences between re-treatment and non-retreatment aneurysms before and after coil embolization using CFD. The slight reduction rate of blood flow velocity in the aneurysm, slightly increased pressure rate at the aneurysmal neck and neck area, and hypertension are the main factors contributing to re-treatment. Our combined parameter, RP, which takes into consideration hemodynamic, morphological, and clinical parameters, more accurately predicts aneurysm re-treatment. We might be also able to predict aneurysmal re-treatment using RP before embolization.
References
Footnotes
Contributors All authors gave final approval of the published version and agreed to be accountable for all aspects of the work in ensuring that questions related to the accuracy or integrity of any part of the work are appropriately investigated and resolved. SF, HT and TS performed the simulations and collected and analyzed the data. CD, TI, HM, MY and YM helped to evaluate the data. SF and HT wrote the manuscript.
Funding This work was supported by Siemens Healthcare K.K. grant number 35993-00211563. JSPS KAKENHI Grant Number JP17J07496.
Competing interests None declared.
Ethics approval This study was approved by the ethics committee of Jikei University School of Medicine.
Provenance and peer review Not commissioned; externally peer reviewed.
Data sharing statement The authors are ready to share spreadsheets from their data acquisition and experimental set-up details on request.