Article Text

Abstract
Federal healthcare spending has been a subject of intense concern as the US Congress continues to search for ways to reduce the budget deficit. The Congressional Budget Office (CBO) estimated that, even though it is growing more slowly than previously projected, federal spending on Medicare, Medicaid and the State Children's Health Insurance Program (SCHIP) will reach nearly $900 billion in 2013. In 2011 the Medicare program paid $68 billion for physicians and other health professional services, 12% of total Medicare spending. Since 2002 the sustainable growth rate (SGR) correction has called for reductions to physician reimbursements; however, Congress has typically staved off these reductions, although the situation remains precarious for physicians who accept Medicare. The fiscal cliff agreement that came into focus at the end of 2012 averted a 26.5% reduction to physician reimbursements related to the SGR correction. Nonetheless, the threat of these devastating cuts continues to loom. The Administration, Congress and others have devised many options to fix this unsustainable situation. This review explores the historical development of the SGR, touches on elements of the formula itself and outlines current proposals for fixing the SGR problem. A recent CBO estimate reduces the potential cost of a 10-year fix of SGR system to $138 billion. This has provided new hope for resolution of this long-standing issue.
- Economics
- Political
Statistics from Altmetric.com
Introduction
Federal spending on healthcare is an obvious target as the US Congress continues to search for ways to reduce the budget deficit. The Congressional Budget Office (CBO) estimated that, although it is growing more slowly than previously projected, federal spending on Medicare, Medicaid and the State Children's Health Insurance Program (SCHIP) will reach nearly $900 billion in 2013, almost 25% of the federal budget and more than 5% of the nation’s GDP.1 It is expected that, without fundamental change, federal healthcare spending will reach $1.8 trillion and consume more than 30% of the federal budget by 2023. Medicare is the dominant component of federal healthcare spending. The CBO estimates that the federal government will spend nearly $600 billion or about two-thirds of its current healthcare outlay on more than 50 million beneficiaries in 2013. More concerning is that the baby boom generation is beginning to become eligible for Medicare with projected beneficiary growth to nearly 70 million by 2023, putting increasing pressure on the program’s finances and federal budget.
Physicians and other health professionals deliver a wide range of services to Medicare beneficiaries. In 2011 the Medicare program paid $68 billion for physician and other health professional services, 12% of total Medicare spending. Based on the SGR, for a little more than a decade physicians in the USA have typically faced significant Medicare program cuts. Having temporarily averted an SGR-driven pay cut of 26.5% on January 1, 2013, the threat of this devastating cut continues to loom large again at the end of the year. In a letter to the Medicare Payment Advisory Commission (MedPAC),2 the Centers for Medicare and Medicaid Services (CMS) projected that, if Congress took no action, the current estimate of the SGR for 2014 is −15.2%, although there is variation in the projected numbers. In addition, across-the-board spending cuts known as sequestration under the Budget Control Act of 2011 subjected physicians to a 2% decline in Medicare reimbursement which took effect on 1 April 2013.
Consequently, without congressional action to replace the SGR and reform physician payment, physicians will once again face a cut in reimbursement while fees will be held at that level as their practice costs continue to rise. These cuts also come at a time when Medicare payments for physician services have already been nearly frozen for more than a decade while the cost of caring for patients has increased by 25%. After adjusting for inflation, average 2021 Medicare payment rates will be just half of what they were in 2001.3
Despite the prevention of negative updates (figure 1), with rising practice cost inflation or medical expenditure index, a wide gap continues to grow between projected payment updates and increasing expenses.

Growing gap between projected payment updates with rising practice cost inflation or medical expenditure index. Source: 2012 Medicare Trustees Report except 2013–14 which is derived from the 2013 Medicare physician payment schedule final rule as adjusted by the American Taxpayer Relief Act of 2012.
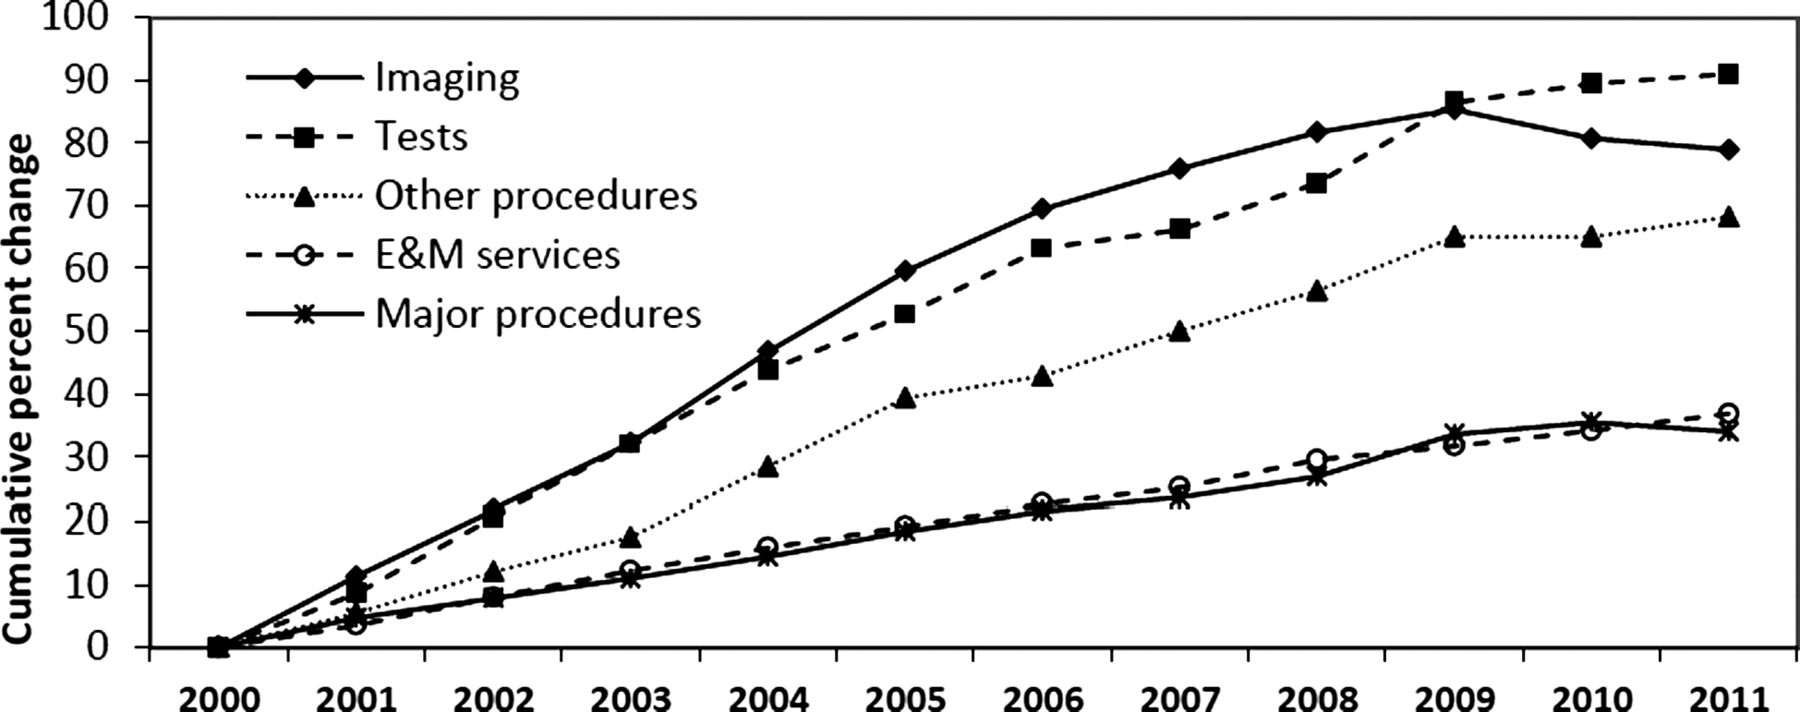
MedPAC, the Administration and Congress now realize that the SGR is fundamentally flawed and is creating instability in the Medicare program for providers and beneficiaries. MedPAC has recommended that Congress should repeal the SGR system for many reasons. The SGR system, which ties annual updates to cumulative expenditures, has failed to restrain volume growth and may even have exacerbated it.4 The SGR does not differentiate between physicians who restrain volume and physicians who do not. For radiologists, this is not good news. Expenses for imaging grew until 2009 and have since shown a small decline (figure 2). MedPAC has laid out its findings and recommendations for moving forward from the SGR system in its October 2011 report to Congress. MedPAC felt that repeal was urgent.4

Growth in the volume of practitioner services, 2000–2011.
There has been a noteworthy slowdown in the growth of healthcare spending which has resulted in a surprising turn of events; estimates for repealing or replacing the SGR have fallen dramatically. Recently, the CBO incorporated the most recent experience with volume growth in their budget estimates,1 with a budget impact of a 10-year freeze being estimated at $138 billion compared with previous estimates of $275 billion. However, the volatility in volume growth seen historically also suggests that the circumstances could change again with a resultant increase in the cost of replacing or repealing the SGR.
With the lower estimate from the CBO of $138 billion to fix the SGR formula, Congress is revitalized to take up the issue. For the authors of this review, there is reason to hope that this might be the time to put an end to a decade-old issue that we have termed the ‘un’sustainable growth rate formula.
History
To understand the Medicare SGR formula, it is essential to understand Medicare physician payment systems, escalating healthcare costs, healthcare reform and SGR as applied in business. The SGR concept in business describes optimal growth from a financial perspective assuming a given strategy with clearly-defined financial frame conditions and limitations. Sustainable growth is defined as the annual percentage of increase in sales that is consistent with a defined financial policy that essentially provides a comprehensive financial framework and formula for company-specific SGR calculations. In contrast, Medicare SGR is a method currently used by the CMS in the USA to control spending by Medicare on physician services.5–9 Enacted by the Balanced Budget Act of 1997 to amend section 1848 of the Society Security Act,10 ,11 the SGR replaced the Medicare Volume Performance Standards (MVPS) which was the previous method used by the CMS in an attempt to control costs. In contrast to the definition of SGR used in business, the Medicare formula is a method to ensure that the yearly increase in the expense for a Medicare beneficiary does not exceed the growth in gross domestic product (GDP).
Medicare was established in 1965. At that time physicians were compensated on the basis of their charges and allowed to balance their books by billing beneficiaries for the full amount above that paid by Medicare for each service. In 1975 the system was changed so that payments could not exceed the increase in the Medicare Economic Index (MEI).6 ,12 The MEI instituted a fixed fee schedule that was based on 1973 prices. The idea of the MEI was to limit annual fee increases to increases in the costs of producing physician services and increases in general earnings levels. Use of the MEI failed to curb increases in costs, leading to the determination of a yearly change in fees by legislation from 1984 to 1991.6 ,12
Medicare Parts B and D are funded from the Supplementary Medical Insurance (SMI) trust fund. Part B helps pay for physicians, outpatient hospitals, some home healthcare and other services for the aged and disabled who have voluntarily enrolled. The SMI trust fund is financed by a combination of beneficiary premiums and general tax revenues. Funding for the SMI trust fund is set at approximately 25% from beneficiary premiums and 75% from general tax revenue.6 ,12
In December 1989, President George H W Bush signed the Omnibus Budget Reconciliation Act of 1989 into law. This act established a Resource-Based Relative Value System (RBRVS) as the basis for Medicare physician reimbursement, which took effect on January 1, 1992.13 ,14
In 1992 this fee schedule essentially replaced the prior payment system that was based on physicians’ charges. Fees continue to rise and, after multiple attempts at modification, in 1998 the system was replaced by a new mechanism—the sustainable growth rate (SGR). Physicians have been living with the consequences ever since.6–9
Policymakers had dual goals in creating the SGR mechanism: (1) to ensure adequate access to physicians’ services and (2) to control federal spending in a more predictable way than the MVPS mechanism.
The key insight of the SGR was to contain increases in physician fees set by the MEI by applying a ‘growth factor’ to the Medicare Part B fee schedule. This growth factor accounted for a variety of predictable variants including changing number of enrollees in Medicare, changes to physician costs, changes to costs associated with laws and regulations that have an impact on healthcare costs and, most critically, changes to inflation and the GDP over time.
Mechanics of the sustainable growth rate (SGR)
The mechanism of the SGR includes three components which are incorporated into a statutory formula: (1) expenditure targets, which are established by applying a growth rate (calculated by a formula) to spending during a base period; (2) the actual growth rate; and (3) the annual updates of payment rates for physicians’ services, which are designed to bring spending in line with expenditure targets over time.
The expenditure targets are established on both a year-by-year and cumulative spending basis. The SGR mechanism uses spending that occurred between April 1, 1996 and March 31, 1997 as a base for all future spending counted toward the targets. This base level totaled $48.9 billion. The spending target for each year is determined by the product of the base level and the growth rate (SGR). A cumulative target is determined by summing together all previous annual targets including the base level.
The actual growth rate formula (SGR) is based on four factors:
-
The estimated percentage change in costs associated with running a physician practice; the change in costs is measured by the MEI.
-
The estimated percentage change in the average number of Medicare Fee For Service (MFFS) beneficiaries.
-
The estimated 10-year average annual percentage change in real (inflation-adjusted) GDP per capita.
-
The estimated percentage change in expenditures due to changes in law or regulations.
The SGR formula is the sum of these four factors:

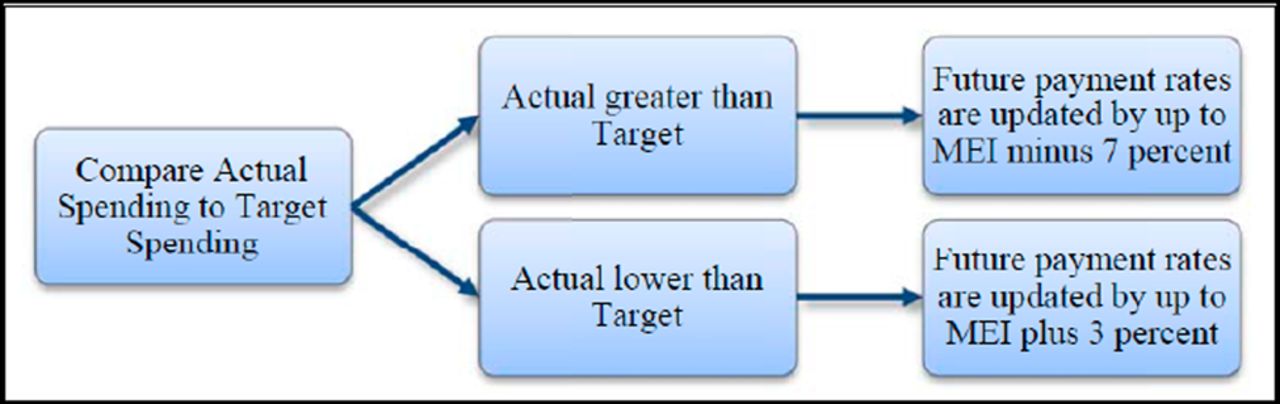
The annual updates to physician payment rates are determined by (1) inflation adjustment according to the MEI and (2) an ‘update adjustment factor’. The update adjustment factor is based on the relationship between actual spending for services and the expenditure targets of the SGR formula. The formula limits the amount of an increase in payment rates each year to inflation plus 3% and it limits a decrease in payment rates each year to inflation minus 7% (figure 3), with inflation being measured by the MEI. The MEI measures changes in the costs of physicians’ times and operating expenses; it is weighted to some of the prices of inputs in those two categories. Changes in the cost of physicians’ time are measured using changes in non-farm labor costs and changes in ‘all factor’ productivity.15

Comparison of actual spending with target spending. Reproduced from Congressional Budget Office.15
The final result of this SGR mechanism is to create an annual update to the critical conversion factor (CF) which is used to ultimately determine physician reimbursement in the RBRVS reimbursement system.

This builds on the relative value physician fee schedule which itself is based on three components—physician work, practice expense and MEI—that are used to determine a value ranking for each service to which it is applied.
Each year the CF is to be adjusted based on the SGR mechanism. Given the rise in actual healthcare costs, proposed CF adjustments have been negative in all of the recent years. However, in practice, Congress has overridden these proposed adjustments in favor of keeping payments stable or slightly higher. The fundamental flaw in these Congressional interventions is that, in order to minimize the ‘cost’ as scored by the CBO, since 2007 Congress did not reset the baseline CF rate. As a result, the cuts demanded by the SGR formula were cumulative, leading to drastic cuts to the CF and, ultimately, to physician reimbursement if the SGR formula was to be actually applied.
Sustainable growth rate (SGR) in practice
Since 2001, spending (as measured by the SGR method) has consistently been above the targets established by the formula.6 ,7 ,16–18 This, of course, would have been anticipated; the growth in healthcare expenditures has exceeded that of general inflation every year since the mid 1970s.19 The necessary consequence of spending exceeding SGR-predicted targets is a reimbursement cut demanded by the SGR formula.
Organized medical associations, led by the American Medical Association (AMA) and joined by specialty organizations such as the American College of Radiology, pointed out the inadequacies of the SGR formula and the potential consequences on care for the elderly if the cuts were enacted. In 2003, Congress responded by increasing payments for physician services by 1.6% instead of the projected 4.4% cut.6 ,16–18 In 2004 and 2005 the Medicare Modernization Act replaced the scheduled rate reduction with an increase of 1.5%.20 In 2006 the Deficit Reduction Act held 2006 payment rates at their 2005 level, overriding an additional impending 4.4% reduction. In 2007 Congress again approved holding the 2008 payments at the 2005 level, thereby avoiding a proposed additional 5.1% reduction. From 2008 to 2012, repeated temporary measures were also undertaken.6–9 16–18
As noted previously, the glaring flaw in Congressional updates to physician reimbursement has been the absence of resetting the baseline CF rate. With each successive Congressional ‘doc fix’, the CF has diverged steadily away from the theoretical CF that was to be applied each year. Thus, doctors moving into 2013 were facing the specter of an epic 26.5% reduction in all physician payments until fiscal cliff negotiations staved off this disaster at the last moment.2–4 16–18
The authors would highlight that a portion of the costs are to be offset by increasing the TC equipment utilization rate for advanced imaging from 75% to 90% to take effect in 2014. The effect of this legislation reduces physician office Medicare payments for advanced imaging by $800 million and hospital reimbursement for radiation therapy by $300 million over 10 years. These cuts are in addition to more than $1 billion in cuts for imaging and radiation therapy services put in place in 2012.
What is the true cost of the SGR?
The SGR targets the product of the growth in the fee-for-service enrollment: inflation-based update factors, real GDP per capita and changes in law or regulation. Actual growth and spending on physician services are compared with a cumulative target growth rate linked to GDP using 1996 as the base year. The formula also limits the amount of an increase in payment rates to inflation plus 10% and it limits a decrease in payment rates to inflation minus 7%, as illustrated in figure 3, with inflation being measured by MEI. The MEI measures changes in the costs of physicians’ time and operating expenses; it is weighted to some of the prices of inputs in those two categories. Changes in the cost of physicians’ time are measured using change in non-farm labor costs and changes in ‘all factor’ productivity.15
MedPAC reported that, while some physicians and other health professionals contribute to the inappropriate volume growth that has resulted in large payment adjustment through the SGR, others have restricted volume (figure 2). However, the SGR does not differentiate between physicians who restrain volume and those who do not. Further, the SGR system, which ties annual update to cumulative expenditures, has failed to restrain volume growth and may have in essence exacerbated it. The Medicare physician fee schedule services grew by 73% from $37 billion to $64 billion from 2000 to 2010, which is more related to the growth in the volume and intensity of services than because of the fee increases.21 ,22 Further, despite congressional interventions to set aside steep SGR mandated physician payment cuts, utilization growth in recent years has been relatively low, though unpredictable. When the SGR began in the late 1990s, the annual volume intensity of growth in Medicare Fee For Schedule (MFFS) ranged from 1.9% to 2.9%. The growth accelerated in 2000 and 2001, reaching a plateau during 2001–2004 with annual growth ranging between 4.6% and 5.8%. The deceleration of the growth rate started in 2005 ranging from 3% to 3.7%, falling to 2.4% in 2010.4 ,7 ,22 ,23
As noted above, whenever Congress blocks a fee reduction it compounds the difference between actual and SGR-driven fees, making the eventual adjustment that much larger. Obviously no industry could function with this type of correction ‘possible pending congressional action’. If Congress continues to enact temporary fixes, prior estimates suggest that the cost of permanent reform already over $250 billion would have escalated to approximately $300 billion for 10 years based on June 2011 estimates.24
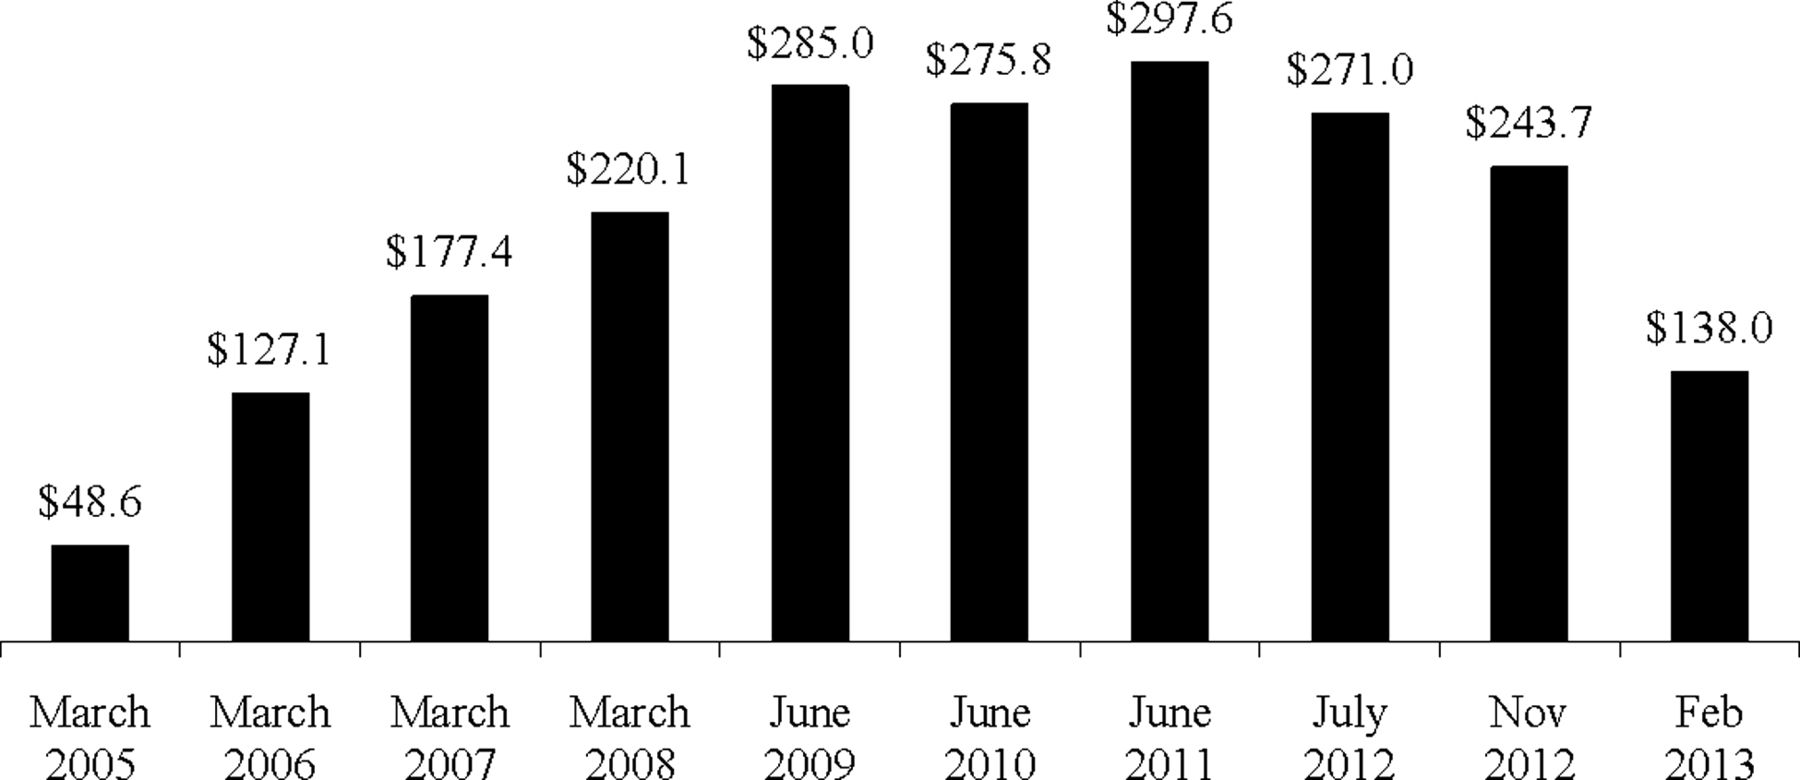
However, in a recent CBO report,1 the amount of funding that Congress needs to eliminate the Medicare SGR formula that helps determine physician pay has dropped significantly after years of lower than expected gains in healthcare spending (figure 4).24 The cost of replacing the Medicare SGR formula has ranged from almost $50 billion to nearly $300 billion. Recent estimates from CBO cut by nearly half its cost estimate for freezing physician reimbursement over a decade. This has created renewed interest in Congress and the Administration to find a formula to fix SGR and find a more permanent Medicare pay solution for less. Based on this new estimate and renewed interest, there are multiple legislative fixes underway in the Congress.

Ten-year freeze estimate (in billions). Source: Congressional Budget Office cost reports.
What can be done?
Physician fear translates into challenges for beneficiaries. We review several of these proposals but note that the Affordable Care Act of 2010, which is now Public Law, did not provide an explicit methodology to deal with the SGR.
American Medical Association (AMA)
The AMA recommends repealing the SGR mechanism. In place of the SGR, the AMA recommends that reimbursement rates be frozen for a period of 5 years while Medicare ‘transitions to an array of new payment models designed to enhance care coordination, quality, appropriateness, and costs’.25
Medicare Payment Advisory Commission (MedPAC)
Like the AMA, MedPAC recommends repealing the SGR mechanism. However, their approach to paying for this is quite different.17 ,26 They propose a 10-year freeze on reimbursement rates for primary care specialties and decreasing rates for all other specialties by 5.9% in each of the first 3 years, followed by a freeze in reimbursement for the following 7 years. In addition, they propose regular data collection by the Secretary of the Department of Health and Human Services to determine new RVUs for each service.
Simpson–Bowles
Alan Simpson and Erskine Bowles led a Presidential Commission (National Commission on Fiscal Responsibility and Reform) created in 2010 by President Obama to identify ‘… policies to improve the fiscal situation in the medium term and to achieve fiscal sustainability over the long run’.2 ,3 The Commission released its report on 1 December 2010. Its recommendations on physician reimbursements under the SGR mechanism included freezing physician payment rates through 2013, then reducing payment rates by 1% in 2014. Importantly, while the SGR system would be reinstated in 2015, it would use 2014 spending as the new base rate and forgive past overspending.27 ,2 ,8
Simpson–Bowles estimated the cost to be $261.7 billion, the Obama administration estimated it to be $293 billion and MedPAC estimated it to be $200 billion. The CBO has provided two options—one with a cliff assuming a 49% reduction to reimbursements in 2018 and reinstating the SGR in 2018 with a cost of $107.7 billion and with an approach of claw which assumes gradual reduction over 10 years to recoup costs and assumes the SGR will be reinstated in 2016 with a cost of $218.5 billion. Thus, the cost of stopping the 2013 Medicare physician payment reduction has changed, increasing by $7 billion for a one-year pay patch that would preserve rates at 2012 levels according to federal budget officials. A 10-year total of a one-year fix with $25.2 billion includes a cost in 2013 of $10.6 billion, $6.7 in 2014 and the remainder through 2022.
Where are we now?
Based on the CBO estimates that repealing the SGR and freezing payments at their current level for the next 10 years would increase spending by approximately $138 billion, Congress is looking at multiple options with a focus that such an investment in funds needs to be accompanied by fiscally-responsible fundamental reform of the Medicare system.
For example, one proposal currently working its way through Congress involves a triphasic approach with Phase 1 involving repeal of the SGR and providing a period of predictable statutorily-defined payment rates. In this particular scenario, Phase 2 entails reforming payment to better reflect the quality of care provided and Phase 3 accounts for the efficiency of the care provided. In relation to this review, we see this proposal as important because the first phase involves ending the SGR ‘reign of terror’.
Conclusion
The SGR is an omnipresent reality. The near-miss aspect of this past year has become ‘expected’. When one considers the fact that providers would face a drop of more than one-quarter of their professional fee overnight, it is so overwhelming that it is actually hard to imagine a circumstance where there wouldn't be some sort of fix. The oddity is that the SGR is nearly universally despised. Providers find it unsettling and beneficiaries have increased uncertainty. Politicians of all types agree that it needs to be fixed. Finally we may have a real chance to fix the SGR; let’s hope it's a chance that US politicians are willing to take.
Footnotes
-
Contributors JAH, DAR, RWL, AD and LM all meet criteria for authorship.
-
Competing interests None.
-
Provenance and peer review Not commissioned; internally peer reviewed.