Article Text

Abstract
Background and objectives: Controversy exists about the optimal imaging technique in acute stroke. It was hypothesised that CT is comparable with DWI, when both are read systematically using quantitative scoring.
Methods: Ischaemic stroke patients who had CT within six hours and DWI within seven hours of onset were included. Five readers used a quantitative scoring system (ASPECTS) to read the baseline (b) and follow up CT and DWI. Use of MRI in acute stroke was also assessed in patients treated with tissue plasminogen activator (tPA) by prospectively recording reasons for exclusion. Patients were followed clinically at three months.
Results: bDWI and bCT were available for 100 consecutive patients (admission median NIHSS = 9). The mean bDWI and bCT ASPECTS were positively related (p<0.001). The level of interrater agreement ranged from good to excellent across all modalities and time periods. Bland–Altman plots showed more variability between bCT and bDWI than at 24 hours. The difference between bCT and bDWI was ⩽2 ASPECTS points. Of bCT scans with ASPECTS 8–10, 81% had DWI ASPECTS 8–10. Patients with bCT ASPECTS of 8–10 were 1.9 times more likely to have a favourable outcome at 90 days than those with a score of 0–7 (95% CI 1.1 to 3.1, p = 0.002). The relative likelihood of favourable outcome with a bDWI ASPECTS 8–10 was 1.4 (95% CI 1.0 to 1.9, p = 0.10). Of patients receiving tPA 45% had contraindications to urgent MRI.
Conclusion: The differences between CT and DWI in visualising early infarction are small when using ASPECTS. CT is faster and more accessible than MRI, and therefore is the better neuroimaging modality for the treatment of acute stroke.
- ASPECTS, Alberta Stroke Programme Early Computed Tomography Score
- CT, computed tomography
- DWI, diffusion-weighted imaging
- EIC, early ischaemic changes
- FLAIR, fluid attenuated inversion recovery
- MRA, magnetic resonance angiography
- MRI, magnetic resonance imaging
- mRS, modified Rankin scale
- NIHSS, National Institutes of Health Stroke Scale
- tPA, tissue plasminogen activator
- computed tomography
- diffusion weighted imaging
- ischaemic stroke
- thrombolysis
Statistics from Altmetric.com
- ASPECTS, Alberta Stroke Programme Early Computed Tomography Score
- CT, computed tomography
- DWI, diffusion-weighted imaging
- EIC, early ischaemic changes
- FLAIR, fluid attenuated inversion recovery
- MRA, magnetic resonance angiography
- MRI, magnetic resonance imaging
- mRS, modified Rankin scale
- NIHSS, National Institutes of Health Stroke Scale
- tPA, tissue plasminogen activator
Tissue plasminogen activator (tPA) when administered for acute ischaemic stroke produces improved outcome,1 and benefit may exist within a treatment window as long as six hours.2,3 However, a small proportion of patients are harmed by symptomatic intracerebral haemorrhage, and more importantly, a large number of patients still have a functionally dependent outcome despite treatment. The importance of early ischaemic changes (EIC) on computed tomography (CT) have been underappreciated until recently, but there is accumulating evidence that EIC on CT prior to the administration of acute stroke therapies can predict both functional outcome and the risk of intracerebral haemorrhage.4–6 Recent advances in neuroimaging, particularly diffusion-weighted imaging (DWI) and perfusion magnetic resonance imaging (MRI), have raised hopes about accurate identification of ischaemic tissue and the ability to discriminate between dead and salvageable ischaemic brain. It is considered that acute ischaemic lesions in DWI can be identified with greater sensitivity than in either conventional MRI or CT.7,8,9,10 The technical superiority of DWI (and perfusion images) has been widely acclaimed, resulting in an enthusiasm to implement MR DWI as the principal imaging modality for acute ischaemic stroke.11,12 It is likely that neuroimaging of the brain during acute stroke with either CT or DWI may tell us about irreversible brain injury, and therefore may be important in defining a response to therapy. Demonstration of the superiority of DWI and perfusion imaging over and above that of conventional imaging techniques such as CT is needed including an assessment of whether these new techniques will affect current clinical management of acute ischaemic stroke.13–15
The objectives of our study were:
-
to compare CT to DWI in acute disabling ischaemic stroke within six hours of symptom onset in detecting early signs of cerebral ischaemia using the Alberta Stroke Programme Early Computed Tomography Score (ASPECTS)6
-
to determine the prognostic value of each imaging technique in predicting outcome
-
to determine the feasibility of performing these techniques in acute stroke.
We hypothesised that the extent of early signs of infarction detectable by CT (both parenchymal hypoattenuation and brain swelling) is equivalent to the extent of the DWI hyperintense signal (representing the restricted diffusion of water) when quantified by ASPECTS, using standardised CT and MR scanning protocols.
PATIENTS AND METHODS
Patients
We recruited patients for this study between October 1999 and July 2001. The principal inclusion criterion for the study was acute disabling ischaemic stroke (National Institutes of Health Stroke Scale (NIHSS) score equal or greater than 1), measured by the NIHSS score within six hours of onset of stroke. We documented the admission NIHSS and enrolled patients if they deteriorated neurologically and fulfilled the inclusion criteria. We included all stroke subtypes (that is, large artery cortical strokes as well as posterior circulation and lacunar strokes). Patients were not excluded on the basis of age alone. All patients sequentially had a CT brain scan within six hours of the onset of stroke followed by an MRI within 7 hours of onset. The rationale for this inclusion criterion was that there is convincing evidence from meta-analyses including tPA trial data that the therapy is beneficial for acute ischaemic stroke as long as six hours from the onset of symptoms2,3 when the CT scan excludes haemorrhage. An additional hour was allowed in such patients to organise the MRI. Some patients who met accepted criteria were treated with intravenous thrombolysis and the ensuing MRI was performed while the tPA infusion was running. No attempt was made to randomise patients to CT or MRI as the initial imaging technique because CT is considered to be the standard imaging modality among patients being considered for tPA, and to avoid unnecessary treatment delays. We collected all information prospectively, including the demographic characteristics, NIHSS score on initial presentation, time of symptom onset and time at each imaging procedure, and functional outcome at three months assessed by the modified Rankin scale (mRS). An experienced stroke neurologist assessed the patients at presentation. A nurse practitioner blinded to admission and imaging details administered the mRS. We defined favourable outcome as independence (mRS 0–2). The data include all patients in a previously published article,16 and are inclusive of 100 of 106 patients reported in another.17 Follow up imaging with either CT or MRI or both was performed at 24 hours.
Imaging protocol
During the study period we attempted to image all patients who were treated with thrombolysis with both modalities. However, we did not routinely sedate patients or perform MRI under general anaesthesia, primarily because we did not want to lose the ability to perform a neurological assessment. Uncooperative or medically unstable patients were therefore excluded from MRI. The feasibility of using MRI for acute stroke imaging was assessed in consecutive patients treated with tPA by prospectively recording successfully completed sequences and the reasons for exclusion.
All CT scans were performed on fourth generation scanners and were considered to be optimal quality according to a standard CT scan protocol (5 mm slice thickness without contrast enhancement, 120 kV, 180 mA at 2 s, contrast favoured algorithm, inferior orbitomeatal baseline, filmed at appropriate window width and level setting of 80/40 HU).
MRI was performed on a 3 T scanner (General Electric Medical Systems, Waukesha, WI) equipped with a standard head quadrature imaging coil and high speed gradients. The rationale for using 3 T MRI rather than 1.5 T MRI is that the former has better signal to noise ratio.18 The MR scanner used in this study is a dedicated system that is available for the urgent imaging of acute stroke patients 24 hours a day, and lies within close proximity of the emergency department. The imaging sequences included sagittal T1-weighted and axial DWI, fluid attenuated inversion recovery (FLAIR) and axial multislab three dimensional time-of-flight magnetic resonance angiography (MRA), and perfusion imaging. Only the DWI and FLAIR sequences were assessed in this study. The isotropic diffusion-weighted images were obtained using a single shot echo-planar imaging (b = 1000 s/mm2 19–5 mm thick slices).
Image reading protocol
Each of five readers blinded to all clinical and patient information apart from side of stroke symptoms independently read each patient’s set of images. The rationale for this was to make the imaging interpretation more clinically relevant. The readers were two “expert” neuroradiology raters and three stroke neurologists. Each set of images was read in isolation and independent of another sequence and technique. The sequence of reading had a specific order: baseline CT, FLAIR, and DWI followed by the follow up CT scan, FLAIR, and DWI. There was a minimum period of one week between readings of images from the same patient.
Each baseline and follow up axial CT or MRI was assessed for ischaemic change and quantified using ASPECTS.6,19 The ASPECTS regions were idealised from two standardised axial cuts, but in practice each reader reviewed the entire sequence of slices to determine the score. The middle cerebral artery territory was allotted 10 points. A single point was subtracted for an area of EIC on CT,4,5 which included any or all of parenchymal hypoattenuation, loss of grey–white differentiation, and focal brain swelling. Parenchymal hypoattenuation was defined as a region of abnormally decreased attenuation of brain structures relative to attenuation of other parts of the same structures or of the contralateral hemisphere. We defined focal brain swelling as any focal narrowing of the cerebrospinal fluid space due to compression by adjacent brain structures producing effacement of the cortical sulci or ventricular compression. For FLAIR and DWI sequences, focal ischaemia was defined by hyperintense signal. ASPECTS methodology was applied to the MRI sequences in an analogous topographical technique as used for CT. A CT or MRI scan without involvement of these areas received an ASPECTS score of 10 points. A score of 0 indicated complete ischaemic involvement throughout the middle cerebral artery territory. All CT and MRI scans were included in the analysis irrespective of stroke vascular stroke territory involved. For instance, a stroke isolated to the brainstem or cerebellum would be given an ASPECTS of 10.
Statistical analysis
The unit of analysis for comparing CT with DWI was the median of the five readers’ assessment of a patient’s image. The median was chosen to represent a consensus measure of a patient’s ASPECTS for a particular modality. Intermodality agreement (among CT, DWI, and FLAIR) was estimated using an intraclass correlation coefficient from a random effects analysis of variance model.20 Estimates of interrater agreement, using the single reading as the unit of analysis, were calculated from a two-way mixed effects analysis of variance (modality was the fixed effect and rater was the random effect).21 Levels of clinical significance for agreement were defined according to the criteria: >0.75 as excellent, 0.40–0.75 as fair to good, and <0.40 as poor.20 A Bland–Altman plot was used to illustrate the magnitude of differences between baseline CT and DWI ASPECTS, and between 24 h CT and DWI ASPECTS.22 Using median scores for each patient and assuming DWI as the reference test the sensitivity and specificity of the baseline CT ASPECTS is presented using a cut-off value of ASPECTS >7 versus ASPECTS ⩽7 as has been described previously.6 In addition, the sensitivity and specificity of each individual baseline CT ASPECTS point is presented by considering the baseline DWI ASPECTS as the gold standard using the median score of the five readers at each ASPECTS point (which yields at minimum a 3 of 5 consensus at each point). Rate ratios (RR) were used to quantify the relation between the dichotomised baseline ASPECTS (categorised as 0–7 v 8–10) and favourable patient outcome at 90 days. The chosen ASPECTS cut-points have been previously used for acute ischaemic stroke patients.6 Exact methods were used where appropriate at conventional levels of statistical significance (α = 0.05).
RESULTS
We enrolled 100 consecutive patients into the study (69% men, mean (SD) age 68 (13.9) years). The admission median NIHSS was 9 (interquartile range 3–16, range 0–32). Two patients were neurologically normal on admission (NIHSS = 0), but both deteriorated neurologically prior to imaging (NIHSS 7 and 19). The mean time from symptom onset to CT was 117 (70) minutes compared with 219 (80) minutes to initiating MRI (mean difference of 102 (51) minutes, p<0.001). A total of 82 patients had CT scans within three hours of the onset of symptoms, of which 42 also had an MRI within the same period. All patients had follow up imaging at 24 hours (80 patients had MRI, 71 patients had CT, and 56 had both). Thirty nine patients received tPA: 33 patients received intravenous tPA alone, and six received a combined approach of intravenous tPA followed by intra-arterial thrombolysis into the angiographically defined thrombus.23 There were nine deaths, of which two were due to tPA related fatal intracerebral haemorrhage. At three months 61% of the patients were independent (mRS 0–2) (two patients were lost to follow-up at three months).
The median baseline CT ASPECTS was 9, and the median baseline DWI ASPECTS was 8. Early CT ischaemic change was found in 66% of the patients (95% confidence interval (CI) 56 to 75), and areas of hyperintense signal were identified in 81% of the DWI scans (95% CI 72 to 88). Six patients (6%) had evidence of posterior circulation ischaemia on baseline DWI with or without coincident anterior circulation stroke.
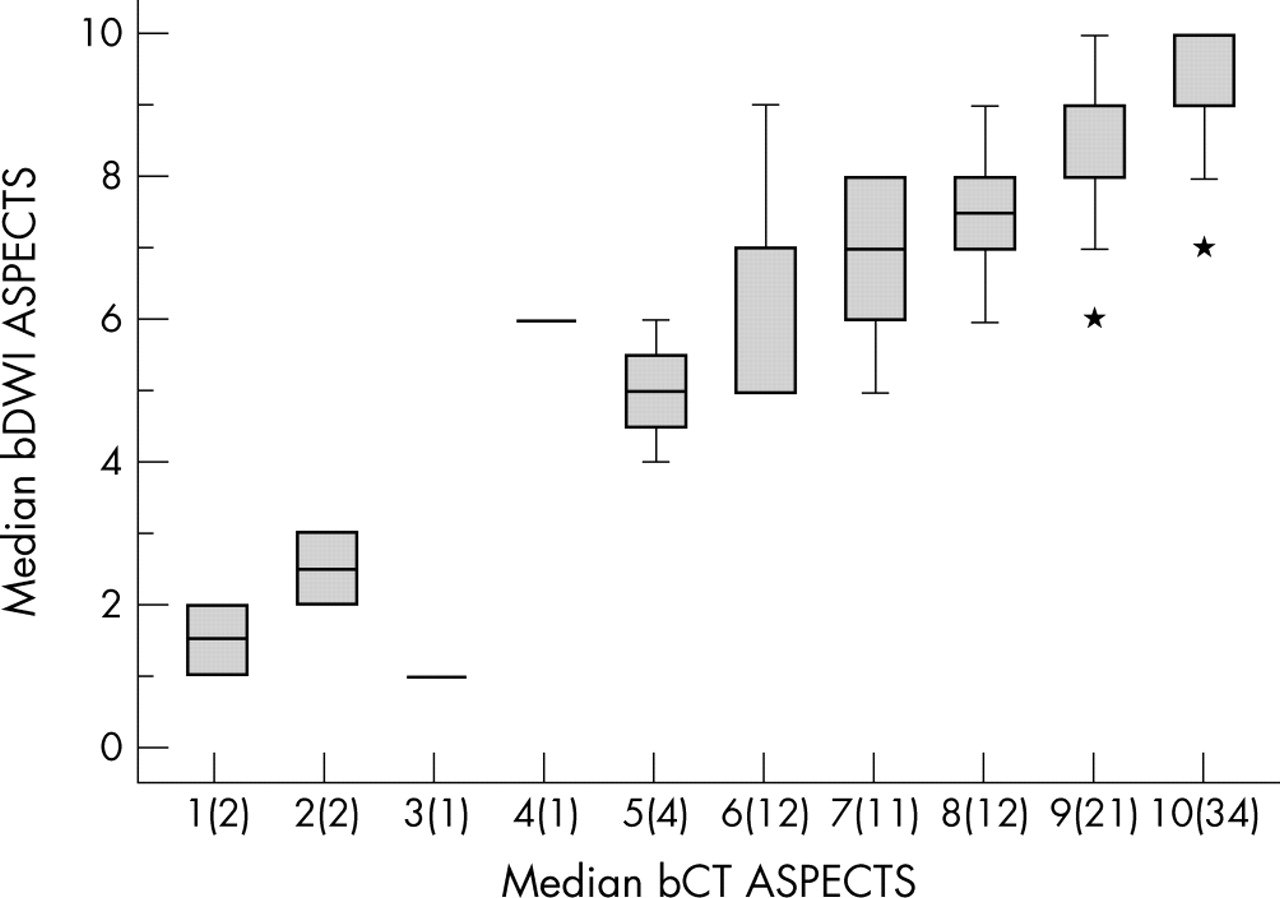
The level of interrater agreement ranged from good to excellent across all modalities and time periods (table 1). The level of agreement between FLAIR and both CT and DWI was poor at baseline, but reached excellent at 24 hours. Only the level of agreement between CT and DWI was consistently excellent at baseline and at 24 hours. The time interval between baseline CT and DWI scans did not affect the level of agreement: r = 0.80, n = 71, 95% CI 0.71 to 1 when the time interval was ⩽120 minutes; and r = 0.81, n = 29, 95% CI 0.67 to 1 when the time interval was >120 minutes. The mean baseline DWI ASPECTS was positively related to the baseline CT ASPECTS (p<0.001, fig 1). The linear relationship between the baseline CT ASPECTS and DWI ASPECTS (β = 0.82 (95% CI 0.73–0.92)) also applied to: follow up CT predicts follow up DWI (β = 0.95 95% CI 0.85–1.04); follow up FLAIR versus follow up DWI (β = 0.99, 95% CI 0.92–1.07); follow up CT predicts follow up FLAIR (β = 0.90 95% CI 0.80–1.0).
Estimates of intermodality and interrater agreement

The whisker plot shows the positive relation between baseline DWI (bDWI) and CT (bCT) ASPECTS The numbers in parentheses on the x-axis represent the number of patients with a median bCT ASPECTS at that score.
The Bland–Altman plots showed more variability between CT and DWI at baseline (fig 2A) than at 24 hours (fig 2B). The difference between CT and DWI at baseline was no greater than 2 ASPECTS points. The sensitivity and specificity of the baseline CT ASPECTS using baseline DWI ASPECTS as the reference test is presented in table 2, and for each individual ASPECTS point in table 3. These figures can be compared with baseline CT ASPECTS and follow up CT ASPECTS (n = 71) as a reference for irreversible tissue injury (sensitivity 91; specificity 71). We would recommend caution in the interpretation of the latter as EIC consisting solely of swelling without either loss of grey–white differentiation or parenchymal hypoattenuation may not represent irreversible tissue injury. There were 34 patients with baseline CT ASPECTS score of 10. Of these, 18 had baseline DWI ASPECTS score of 10. The baseline DWI was less than 10 in 16: ASPECTS 9 (n = 8); ASPECTS 8 (n = 6); ASPECTS 7 (n = 2). Baseline DWI was therefore abnormal in 47% (95% CI 30 to 65) of this select group.
Sensitivity and specificity of baseline CT ASPECTS compared with the reference test baseline DWI ASPECTS
Sensitivity and specificity of each individual baseline CT ASPECTS point compared with the baseline DWI ASPECTS using the median score at each ASPECTS point of five readers

(A) Bland–Altman plot of baseline DWI (bDWI) and CT (bCT) ASPECTS. The mean ASPECTS difference between the two modalities was +0.43 indicating that slightly more ischaemic change is observed on average in DWI scans. Random jitter has been added to illustrate the number of measurements at each ASPECTS point. The horizontal lines represent the mean difference in scores and the mean (SD). (B) Bland–Altman plot of 24 hour follow up DWI (fuDWI) and CT (fuCT) ASPECTS. The mean ASPECTS difference between the two modalities was +0.64 indicating that more ischaemic change is observed on average in DWI scans. Random jitter has been added to illustrate the number of measurements at each ASPECTS point. The horizontal lines represent the mean difference in scores and the mean (SD).
Patients with a baseline CT ASPECTS of 8–10 were 1.9 times more likely to have a favourable outcome at 90 days than those with a score of 0–7 (95% CI 1.1 to 3.1, p = 0.002). The relative likelihood of favourable outcome was less with a baseline DWI ASPECTS of 8–10 (RR 1.4, 95% CI 1.0 to 1.9, p = 0.10).
Of 112 patients who were treated with tPA during the study period, 39 patients (34.8%) were enrolled into the present study. Fifty patients (45% of the 112) had contraindications to urgent MRI, a very similar figure to a recent report24: 26 (23.2%) were medically unstable and unsafe for MRI (reduced level of consciousness, vomiting, cardiac arrhythmia, aspiration) despite our ability to monitor blood pressure, pulse oximetry; 14 (12.5%) patients were too restless to cooperate with imaging; 10 (8.9%) had MRI exclusions (pacemakers, cardiac prostheses). The remaining 23 (20.5%) either did not meet the time restrictions of the study or were not imaged because of unavailability or servicing of the MR scanner.
DISCUSSION
Our study shows that CT and DWI are comparable for detecting and quantifying signs of cerebral ischaemia in acute disabling stroke when they are of good quality and are assessed systemically using ASPECTS. However, this does not imply the two modalities are equivalent. ASPECTS values were lower for diffusion MR images implying that DWI is more sensitive than CT at detecting ischaemic tissue changes. Analogous to CT stroke lesion quantification, ASPECTS provides a reliable and novel method of assessing the DWI stroke lesion, despite differences in the image contrast mechanisms. There is a positive relation between the CT ASPECTS and the DWI ASPECTS—that is, CT predicts the DWI lesion performed at a later time point (fig 1). DWI was performed on average 102 minutes after CT and may have accounted for some of the differences in ASPECTS values, although statistically we were not able to demonstrate that time was a confounder.
The interobserver reliability was very good between the neuroradiologists and stroke neurologists and suggests that the application of ASPECTS in acute stroke can be generalised. It has been previously shown that radiology trainees and prospective non-expert assessment of the CT at the bedside can obtain very good interobserver reliability using ASPECTS.6,25 However, despite excellent intermodality agreement between baseline CT ASPECTS and DWI ASPECTS a review of the Bland–Altman plots suggests the limits of agreement are approximately 2 units from the mean difference scores. Neither baseline CT ASPECTS nor DWI ASPECTS is preferentially scored higher or lower. The observation that DWI shows similar variability to CT among experienced observers is widely underappreciated. One important reason for the variability between CT and DWI ASPECTS during the early stages of stroke onset relates to the difficulties of detecting early cerebral infarction, which appears to be less at 24 hours, as the limits of agreement appear closer together (fig 2B). This issue is further emphasised when each individual baseline CT ASPECTS value is compared with each DWI ASPECTS value by anatomical locality. Although the sensitivity is high for each individual CT ASPECTS value the specificity in the cortical areas (M2–M6) ranges from 40% to 60%. This perhaps implies that CT is visualising a disease process in addition to cytotoxic oedema, such as blood flow change, not detectable by DWI. CT visualises both density change and swelling whereas DWI mainly visualises signal change, and anatomical definition of the latter is inferior to that of CT (see fig 3).

A 59 year old woman presented to her local hospital with aphasia and right hemiparesis within 45 minutes of symptom onset. A CT scan was performed urgently of which (A) and (B) are representative. Early CT ischaemic changes of M1, M2, I, M4, and M5 are seen, an ASPECTS value of 5. Tissue plasminogen activator was administered intravenously on the basis of the severe stroke and the absence of intracerebral haemorrhage on the CT scan. (C) and (D) are representative slices of the diffusion-weighted image performed an hour later. The DWI ASPECTS was also 5. She was functionally dependent at three months.
Our present data would have supported previous conclusions that DWI is more sensitive than CT in both the anterior and posterior circulation,11,12,26 but the magnitude of the superior sensitivity over CT is small within the first six hours. When the CT scan is normal or near-normal, the DWI scan may show small discrete evidence of ischaemic change not seen on CT. In such cases DWI may help confirm the location of the stroke and the aetiology, for example, in the case of cardioembolic stroke detecting a “shower” of emboli. This type of information regarding the location and mechanism of stroke may be important in preventing further stroke, but the NINDS tPA Study confirmed that the response to treatment was independent of stroke aetiology.1 The risk of haemorrhage after thrombolytic therapy may be related to large areas of ischaemic change, but missing a small region of EIC on CT that might have been demonstrated on DWI may be less important for the treatment decision because patients with ASPECTS values of 10 or 9 are more likely to have a good functional recovery.6
Studies comparing CT and DWI, including those reported recently,26 used the 1/3 middle cerebral artery (MCA) rule which broadly categorises stroke size into “large” or “small”, whereas ASPECTS allows the opportunity to quantify topographical differences between CT and DWI.6,19 The improved reliability of ASPECTS over the 1/3 MCA rule in the detection of EIC has been recently contradicted.27 One study randomised the order in which CT and MRI were performed.26 In this study, the main outcome was the presence or absence of stroke signs on either neuroimaging procedure. The study did not assess the feasibility of performing urgent MRI in acutely ill stroke patients or address the clinical impact of DWI.
The two modalities provide complementary information in terms of the extent of the stroke lesion but there are also significant differences. DWI is sensitive to areas of ischaemic brain with restricted diffusibility of water and can detect very small areas of ischaemic cerebrum. However, controversy still remains as to whether the DWI lesion represents irreversibly damaged tissue (that is, the “core”). Recent published work suggests that the DWI lesion includes both core and penumbra,28 and that an apparent diffusion threshold (ADC) cannot be determined within the first few hours of stroke.29,30 This issue is critical if DWI is to be used in patient selection for thrombolysis. The value of CT in detecting ischaemic brain injury is supported by this study. Early parenchymal hypoattenuation seen in CT soon after stroke have been previously correlated with early cytotoxic oedema, but our study would also support the hypothesis that hypoattenuation, particularly observed in the cortical areas may represent changes in blood flow.
Reliance on MRI as the preferred imaging modality for the urgent assessment of stroke patients may restrict the use of the therapy in eligible patients; acutely ill stroke patients make very poor MRI subjects. This is of even greater importance in the light that a superior clinical benefit of DWI over CT in terms of determining prognosis could not be defined in this study when employing ASPECTS. Approximately half of patients treated with intravenous tPA and considered eligible for this study were discovered to have had an exclusion to MRI during the screening process, or were unable to complete the scan protocol either because they were intolerant of the procedure or were considered to be medically unstable. This observation is consistent with a smaller study in the literature.24 Overreliance on DWI MRI may restrict the availability and accessibility of thrombolysis for acute stroke patients.31
The strong evidence of benefit from intravenous thrombolysis based upon a systematic review (Cochrane) of six randomised clinical trials2 is heavily time dependent.32 While CT and MRI provide complementary information in some respects, time dictates choosing one imaging procedure before making a therapeutic decision. Both MR and CT are evolving ultrafast imaging protocols that can provide supplementary non-invasive angiographic and tissue perfusion data.33,34 Also of importance, gradient echo sequences are available for the detection of haemorrhagic transformation and “microbleeds” with greater sensitivity than CT.35 However, within current stroke guidelines for thrombolysis administration, and outside of the current three hour paradigm both multimodal MR36 or CT imaging (CT angiography and CT perfusion)37 may show great promise in refining patient selection but neither technique has yet been shown to be more efficacious than non-contrast CT.
SUMMARY
Among patients with moderate to severe acute ischaemic stroke, the ability of CT to detect signs of early cerebral infarction is comparable with DWI. The decision about which imaging technology to use in acute stroke will depend on the feasibility and availability of that modality. Non-contrast CT is accessible, versatile, and fast, and therefore is a better choice in the imaging of acute stroke than MRI when considering thrombolytic therapy. Its use extends beyond that of identifying intracranial haemorrhage. We emphasise the importance of clinical assessment of the patient, supported by a systematic approach (ASPECTS) to assessing the CT for defining the extent of ischaemic brain injury.
Acknowledgments
The authors thank Kathryn Werdal and Andrea Cole-Haskayne for administrative aid in organising films for review.
REFERENCES
Footnotes
-
The study was supported by the Alberta Foundation for Health Research.
-
Competing interests: none declared
-
Dr Barber was supported by the Canadian Institute of Health Research, Heart and Stroke Foundation of Canada, and Alberta Heritage Foundation for Medical Research; Dr Hill was supported by the Heart and Stroke Foundation of Alberta, NWT, Nunavut and the Canadian Institutes for Health Research; Dr Demchuk was supported by Alberta Heritage Foundation for Medical Research, Canadian Institute of Health Research; Dr Eliasziw was supported by Alberta Heritage Foundation for Medical Research; Dr Tomanek was supported by Alberta Heritage Foundation for Medical Research; Dr Frayne was supported by Heart and Stroke Foundation of Canada and Alberta Heritage Foundation for Medical Research; Dr Buchan was supported by the Heart and Stroke Foundation of Canada, and Alberta Heritage Foundation for Medical Research