Article Text

Abstract
Background Intracranial fusiform aneurysms are complex and poorly characterized vascular lesions. High-resolution magnetic resonance imaging (HR-MRI) and computational morphological analysis may be used to characterize cerebral fusiform aneurysms.
Objective To use advanced imaging and computational analysis to understand the unique pathophysiology, and determine possible underlying mechanisms of instability of cerebral fusiform aneurysms.
Methods Patients with unruptured intracranial aneurysms prospectively underwent imaging with 3T HR-MRI at diagnosis. Aneurysmal wall enhancement was objectively quantified using signal intensity after normalization of the contrast ratio (CR) with the pituitary stalk. Enhancement between saccular and fusiform aneurysms was compared, as well as enhancement characteristics of fusiform aneurysms. The presence of microhemorrhages in fusiform aneurysms was determined with quantitative susceptibility mapping (QSM). Three distinct types of fusiform aneurysms were analyzed with computational fluid dynamics (CFD) and finite element analysis (FEA).
Results A total of 130 patients with 160 aneurysms underwent HR-MRI. 136 aneurysms were saccular and 24 were fusiform. Fusiform aneurysms had a significantly higher CR and diameter than saccular aneurysms. Enhancing fusiform aneurysms exhibited more enhancement of reference vessels than non-enhancing fusiform aneurysms. Ten fusiform aneurysms underwent QSM analysis, and five aneurysms showed microhemorrhages. Microhemorrhage-positive aneurysms had a larger volume, diameter, and greater enhancement than aneurysms without microhemorrhage. Three types of fusiform aneurysms exhibited different CFD and FEA patterns.
Conclusion Fusiform aneurysms exhibited more contrast enhancement than saccular aneurysms. Enhancing fusiform aneurysms had larger volume and diameter, more enhancement of reference vessels, and more often exhibited microhemorrhage than non-enhancing aneurysms. CFD and FEA suggest that various pathophysiological processes determine the formation and growth of fusiform aneurysms.
- aneurysm
- blood flow
- MRI
- technology
- vessel wall
Data availability statement
All data relevant to the study are included in the article or uploaded as supplementary information. Raw data were generated at the University of Iowa. Derived data supporting the findings of this study are available from the corresponding author EAS, on request.
Statistics from Altmetric.com
Introduction
Fusiform aneurysms represent 3–13% of intracranial aneurysms.1–3 Their management is controversial, largely because of the paucity of data related to their pathogenesis and morphological characteristics. Possible etiological causes include dissection, atherosclerosis, and collagen diseases.3–5 Fusiform aneurysms may lead to ischemic stroke, brainstem compression, cranial nerve neuropathy, subarachnoid hemorrhage, and death. The estimated 5-year fatality of fusiform aneurysm can be as high as 36.2%, as some of these lesions become unstable and experience rapid morphological changes.6 Fusiform aneurysms located in the vertebrobasilar (VB) junction may have a 6.5%/year rate of growth and a 1.5%/year rate of rupture.7
Based on pathological findings, Mizutani et al classified non-atherosclerotic fusiform and dissecting aneurysms as type 1, classic dissecting aneurysms; type 2, segmental ectasia; type 3, dolichoectatic dissecting aneurysms; and type 4, saccular aneurysms at a non-branching site.8 This classification provided valuable insight into the pathophysiology of fusiform aneurysms; however, it excluded atherosclerotic lesions and lacked any radiological correlation between aneurysm subtypes and their pathological features. Flemming et al proposed a simpler classification: fusiform, dolichoectatic, and transitional.9 Fusiform aneurysm are dilations 1.5 times the normal diameter without a definable neck. Dolichoectatic are uniform dilation of an artery greater than 1.5 times normal, and transitional aneurysms are uniform aneurysm dilation of an entire arterial segment greater than 1.5 times normal, involving the vertebral artery (VA), basilar artery (BA), or both, with a superimposed dilation of the involved arterial segment.10 Aneurysms that could not be classified in these categories were defined as undetermined. There is a large range of fusiform aneurysms, which may reflect the spectrum of disease processes that lead to a fusiform appearance of the affected arterial segment.
The aim of this study is to use advanced imaging and computational analysis to understand the unique pathophysiology, and determine possible underlying mechanisms of instability, of cerebral fusiform aneurysms.
Methods
Patient population and data collection
After approval from the institutional review board, patients with unruptured intracranial aneurysm (UIAs) underwent 3T HR-MRI at diagnosis from March 2018 to June 2020. Fusiform aneurysms were defined as a vessel wall dilation greater than 1.5 times normal without a clearly discernible aneurysm neck.1 11 UIAs located in the cavernous segment of the internal carotid artery (ICA) were excluded owing to artifact from avid contrast enhancement of the cavernous sinus in post-contrast T1-MRI sequences. UIAs with poor image quality and motion artifact, and UIAs ≤2 mm in size were also excluded. Relevant patient demographic and clinical information was obtained from electronic medical records. Fusiform aneurysms were classified as associated with atherosclerosis based on the determination of two neuroradiologists and as previously described.12
Imaging acquisition
Images were acquired with a 3T Siemens scanner (Siemens MAGNETOM Skyra, Germany). The HR-MRI protocol included a 3D T1-weighted SPACE fast-spin-echo (CUBE), T2-weighted CUBE, 3D time-of-flight, and 3D susceptibility-weighted angiogram. Gadobutrol (Gadavist, Bayer Pharmaceuticals, New Jersey, USA) was administered intravenously (0.1 mmol/kg), and a postcontrast 3D TI CUBE sequence was obtained after ≈5 min. Acquisition parameters are shown in online supplemental table e–1.
Supplemental material
HR-MRI assessment
Images were analyzed with Picture Archiving Communication System software, version 12.1.6.1005 (Carestream Vue PACS, New York, USA). The protocol for assessing aneurysmal wall enhancement in HR-MRI has been described previously.13 14 Briefly, post-contrast T1-weighted sequences were co-registered in axial, coronal, and sagittal views. A 2D region of interest was drawn along the aneurysm wall and in each plane at the point of maximal diameter (online supplemental figure e-1). Wall enhancement was objectively quantified for saccular and fusiform aneurysms using the aneurysm-to-pituitary stalk contrast ratio (CR).13 Normalization to the pituitary stalk was performed as: post-contrast maximal or mean signal intensity (SI) of the aneurysm wall divided by the post-contrast maximal or mean SI of the pituitary stalk: CR= (SIwall post)/(SIstalk post). Additionally, the CR of a reference vessel (RV) was analyzed for each patient with a fusiform aneurysm. RV measurements were taken from either the left or right M1 segments of the middle cerebral artery.15 Enhancement was defined as a CR ≥0.600.13
Microhemorrhage detection
Quantitative susceptibility mapping (QSM) images were imported to a Horos medical image viewer (Nimble Co LLC, Maryland, USA) and condensed to a single folder. Using the Matlab toolbox, STI Suite, Laplacian-based phase processing was performed on QSM files to produce tissue phase visualization.16 The subsequent images were then co-registered on 3D-Slicer with MR angiography sequences. The aneurysmal wall was assessed at a minimum threshold of 100 and the highest maximal threshold to identify microhemorrhages at the interface of the aneurysm wall and brain tissue (figure 1). 3D volumetric reconstructions were conducted by incorporating the microhemorrhage segmentation with the aneurysm, according to Nakagawa et al. 17
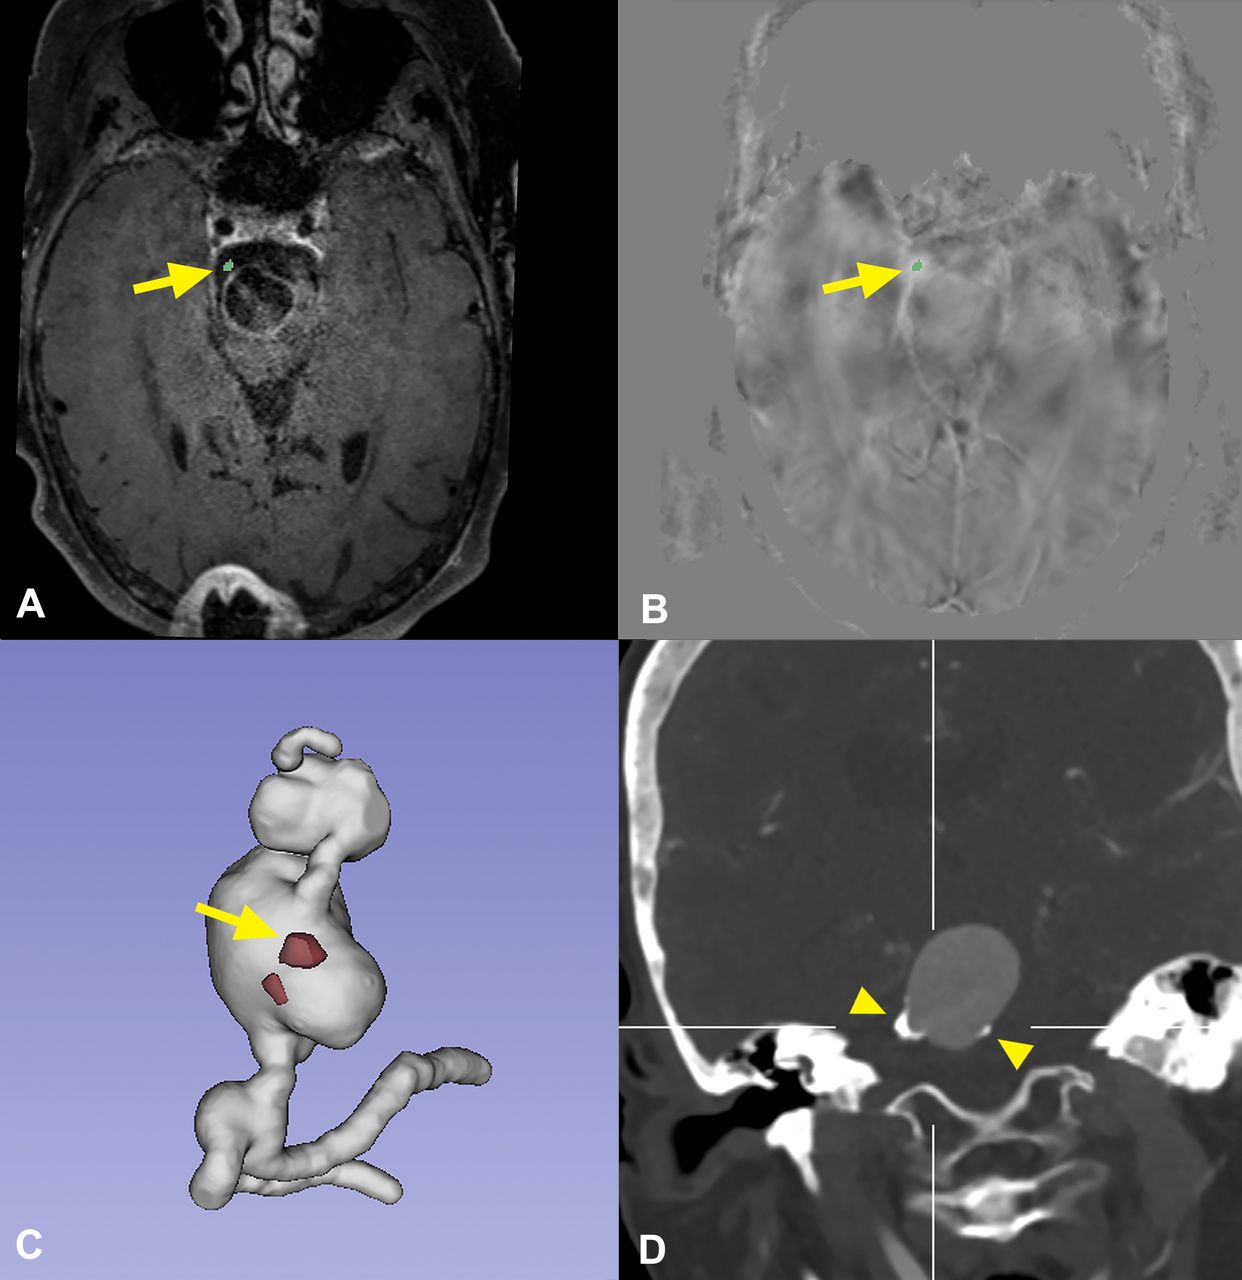
(A) T1-post-gadolinium MRI shows a large fusiform aneurysm with a microhemorrhage at the interface of the aneurysm wall and brain tissue (arrow). T1-post-gadolinium is co-registered with processed quantitative susceptibility aneurysm sequences (B) used to locate the microhemorrhage (threshold >100). Arrows show the areas of microhemorrhage. (C) 3D reconstruction of hemorrhagic threshold within the mid-basilar fusiform aneurysm. (D) CT angiography shows the complex appearance of the aneurysmal wall with thick atherosclerotic plaques (arrow heads). This aneurysm wall displays two biological processes of advanced atherosclerosis: hemorrhage and calcification.
Segmentation and volume analysis of fusiform aneurysms
Images were analyzed with Insight Toolkit - Sentinel Application Platform (ITK-SNAP), version 3.8. Post-contrast T1-weighted and time-of-flight MR angiography sequences were co-registered. Active contour segmentation mode was used to localize the aneurysm in a 3D region of interest simultaneously in axial, coronal, and sagittal planes. After adjusting the threshold to include only the lumen of the vessel, focal points of interest in the vessel could expand within the confines of the thresholding parameters and segment the vessel lumen. The aneurysm boundaries were defined where the parent vessel widened to 1.5 times normal. Segmentations and volume measurements were confirmed by two independent investigators.
Computational fluid dynamics (CFD) and finite element analysis (FEA) of fusiform aneurysm
Three patients harboring four different types of fusiform aneurysms were selected for CFD and FEA. The following aneurysms were included: two highly enhancing non-atherosclerotic aneurysms, a non-enhancing and non-atherosclerotic fusiform aneurysm, and a highly enhancing aneurysm with extensive atherosclerosis. Vessel segmentation and pulsatile flow modelling were performed with Vascular Modelling Toolkit (Orobix SRL, Italy).18 Blood was assumed to be a Newtonian fluid with a viscosity of 3.5 cP and density of 1060 kg/m3.19 The simulations were performed using ANSYS Fluent (ANSYS, Inc, Pennsylvania, USA).20 This analysis aimed to characterize wall shear stress (WSS) and the oscillatory shear index (OSI), and to represent flow patterns through different geometries of fusiform aneurysms. Postprocessing was carried out using Tecplot (TecPlot Inc, Bellevue, Washington, USA).
FEA was performed according to a previously described protocol18 to compute the pressure-induced von Mises stress (VMS) throughout the aneurysm. The base reconstructions used for FEA were the same as those used for CFD analysis. Shell meshes of 3-noded triangular elements with an 86 µm thickness were produced from the surface faces of each CFD mesh. Aneurysmal wall properties were modeled by an isotropic and homogeneous strain energy density function with a third order polynomial form:
W = C1 (I1 - 3) + C2 (I1 - 3)2 + C3 (I1 - 3)3
Where I1 is the first invariant of the right Cauchy-Green tensor, C1=3 MPa, C2=−14.35 MPa, and C3=63.57 MPa.18 Displacements were fixed on the inlets and outlets of the vasculature. An outward uniform pressure equal to the systolic pressure of each subject was applied to the entire surface of the model. A static structural analysis was performed on the models using the ANSYS mechanical APDL solver.
Statistical analysis
All statistical calculations were performed with SPSS Statistics 25 (IBM, New York, USA). Categorical variables are presented as frequency and percentage, and continuous variables as mean±SD. A Student t-test was used to compare continuous data, and Pearson chi-squared test for categorical data. Pearson’s coefficient was used to analyze correlation between aneurysm wall enhancement, diameter, volume, and reference vessel wall enhancement. Multivariable logistic regression was used to assess factors associated with vessel wall enhancement; variables with a p value <0.20 after univariate binary logistic regression were included in the multivariable regression model. A two-sided p value <0.05 was considered significant.
Results
Aneurysm characteristics
One hundred and thirty patients with 184 aneurysms underwent HR-MRI. Twenty-four aneurysms (13%) were excluded: seven with poor image quality or artifact, nine of ≤2 mm, and eight located in the cavernous sinus. A total of 160 UIAs were analyzed: 136 saccular and 24 fusiform (table 1). The mean age was 63.4±12.7 years, and 85.6% were women. Sixty-four (40%) aneurysms were symptomatic. Fifty-five aneurysms (34.4%) were enhancing, and the mean diameter of all UIAs was 7.7±6.1 mm.
Baseline characteristics of saccular and fusiform aneurysms
Fusiform versus saccular aneurysm
The mean age of patients with fusiform and saccular aneurysms was 66.0±12.8 and 62.9±12.7 years, respectively. Fusiform aneurysms were less prevalent in women than saccular aneurysms (62.5% vs 89.7%, p<0.001). Fusiform aneurysms were more likely to enhance as compared with saccular aneurysms (66.7% vs 35.3%, p=0.004). Two-tailed Student’s t-tests demonstrated that fusiform aneurysms had higher CR (0.86±0.34) than saccular aneurysms (0.56±0.19, p<0.001). Fusiform aneurysms also had a significantly larger diameter than saccular aneurysms (12.3±7.8 mm vs 6.8±5.3 mm, p=0.001).
In univariate binary logistic regression analysis, enhancement was correlated with fusiform morphology (OR=3.67), larger diameter (OR=1.33), and smoking (OR=1.82). In a multivariable logistic regression (variables with p value <0.20) aneurysm diameter was the only independent factor significantly associated with enhancement (OR=1.30, p<0.001; online supplemental table e-2).
Characteristics of fusiform aneurysms
Fusiform aneurysms were grouped as ‘enhancing’ (CR ≥0.60) or ‘non-enhancing’ (table 2). Using a two-tailed Student’s t-test, the volume of enhancing aneurysms was significantly higher than that of non-enhancing fusiform aneurysms (4469.8±4974.8 mm3 vs 680.1±856.7 mm3, p=0.016). The diameter was significantly larger in enhancing than in non-enhancing aneurysms (17.0±7.7 mm vs 7.6±4.5 mm, p=0.001), and the CR was significantly higher in enhancing fusiform aneurysms (0.90±0.17 vs 0.41±0.13, p<0.001). Additionally, the RV of enhancing aneurysms had higher CR, when compared with non-enhancing aneurysms (0.43±0.06 vs 0.33±0.10, p=0.007). Mural thrombosis was more prevalent in enhancing fusiform aneurysms than in the non-enhancing group (n=8 (66.7%) vs n=2 (16.7%), p=0.013). There was no significant difference in the presence of atherosclerosis, hypertension, hyperlipidemia, diabetes, smoking status, aneurysm location, aspirin intake, or presentation with symptoms between the two groups. Pearson coefficients showed a positive association between CR and aneurysm volume (0.432, p=0.035), aneurysm diameter (0.600, p=0.002) and RVs CR (0.514, p=0.010; online supplemental figure e-2). The analysis of aneurysm type showed that enhancement of the aneurysmal wall was significantly associated with Flemming’s fusiform classification (p=0.014) and with Mizutani’s classification type 2 (p=0.003) and type 3 (p=0.001).
Baseline characteristics of enhancing and non-enhancing fusiform aneurysms
Seven patients harboring 10 fusiform aneurysms had adequate QSM imaging. Five aneurysms had microhemorrhages (online supplemental table e-3) at the interface of the aneurysm wall and brain tissue. Only four of these five aneurysms (80%) had mural thrombus seen on T1-weighted imaging. Using a two-tailed Student’s t-test, fusiform aneurysms with microhemorrhages had higher CR (0.76±0.13 vs 0.32±0.06, p<0.001), larger volume (2569.4±2166.9 mm vs 204.5±107.5 mm,p=0.041), and diameter (15.1±5.1 mm vs 4.7±0.76 mm,p=0.002) than aneurysms without microhemorrhages. Additionally, fusiform aneurysms with microhemorrhages enhanced more than aneurysms without microhemorrhage (80% vs 0%, p=0.010). Symptomatic presentation had no association with the presence of microhemorrhage (p=0.291).
Computational fluid dynamics and finite element analysis of fusiform aneurysms
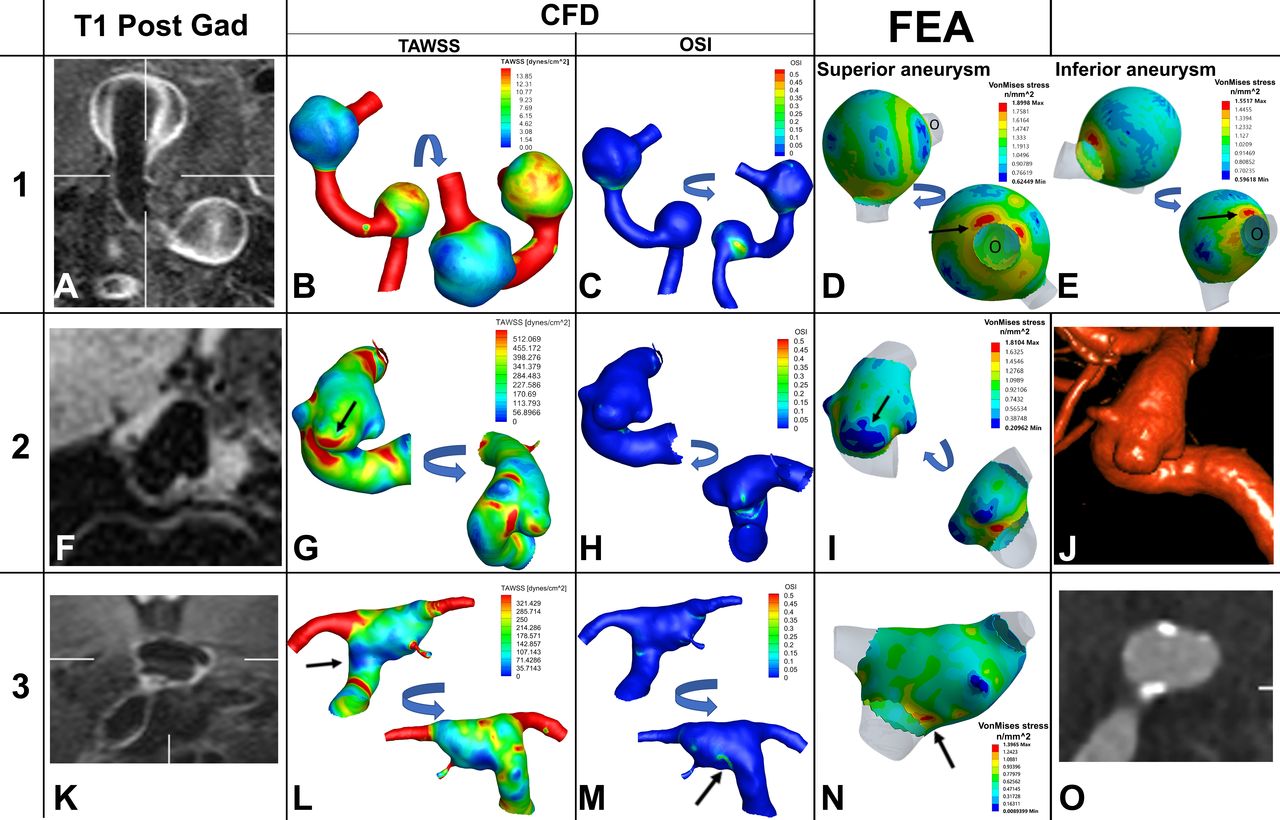
Patient 1 (two non-enhancing and non-atherosclerotic VB aneurysms): These two aneurysms localized in a dilated and dolichoectatic VB segment (figure 2A–E and online supplemental video 1). Both proximal and distal aneurysms showed vigorous contrast enhancement (CR=1.07 and 1.1, respectively). The time-averaged wall shear stress (TAWSS) distribution in this model is confounded by a possible cushion effect of the first aneurysm into the blood flow to the second more distal aneurysm. TAWSS ranged from 0.325 to 42.85 dynes/cm2 on the proximal aneurysm, and 1.10 to 14.57 dynes/cm2 on the distal aneurysm. VMS achieved top values along the area of outflow of both the proximal (1.9 MPa) and distal (1.55 MPa) aneurysms.
Supplementary video

Patient 1 (A–E) has two fusiform aneurysms along the left vertebrobasilar arteries: highly enhancing and non-atherosclerotic. (A) Coronal T1-post high-resolution MRI demonstrates high enhancement of the aneurysm wall. Patient 2 (F–J) has a non-enhancing and non-atherosclerotic fusiform aneurysm in the internal carotid artery (F). Patient 3 (K–O) has an atherosclerotic and enhancing fusiform aneurysm at the basilar tip (K,O). In patient 1, the inferior (proximal) aneurysm has a higher TAWSS than the superior (distal) aneurysm (B). The OSI (C) showed a probable area of vorticity in the proximal aneurysm. The VMS was increased at the outlet of both aneurysms (D and E, arrows). Patient 2, presents with a saccular aneurysm arising from a fusiform base. The highest TAWSS is seen at the ‘dome’ close to the neck of the aneurysm (G, arrow); this pattern has been correlated with areas of growth.34 Meanwhile, a lower VMS area (I, arrow) overlaps the highest TAWSS area. A low VMS has been correlated with a lower risk of rupture.36 A 3D rotation angiogram reconstruction (J) was provided to visualize the complex morphology of this aneurysm with a fusiform base and two domes that show different patterns of wall shear stress, OSI, and FEA, probably related to the inflow from the neck (online supplemental video 1). Patient 3 shows a low TAWSS in the area of widening of the basilar aneurysm (L, arrow) and with a higher OSI in the same area (M, arrow). The highest area of VMS colocalizes with the previously seen low TAWSS (N, arrow). CT angiography (O) shows atherosclerosis with calcified walls along the entire aneurysm. *For each aneurysm an anatomically oriented segmentation is shown first, and an additional region of interest is immediately to the right to show the area that had the most relevant changes. CFD, computational fluid dynamics; FEA, finite element analysis; OSI: oscillatory shear index; TAWSS, time averaged wall shear stress; VMS, von Mises stress.
Patient 2 (one non-enhancing and non-atherosclerotic ICA aneurysm): This aneurysm has the geometry of aneurysms more often encountered in the ICA: dysplastic ICA with a saccular-shaped aneurysm arising from a wide base. This aneurysm had no enhancement (CR=0.33). TAWSS ranged from 13.6 to 1249.6 dynes/cm2, with values peaking at the aneurysm dome closer to the neck (figure 2F-J and online supplemental video 1). No significant difference was noted at the transition zone between the parent vessel and the aneurysm sac. VMS ranged from 0.21 to 1.81 MPa, with areas of minimal VMS at the proximal and distal domes.
Patient 3 (enhancing and atherosclerotic BA aneurysm): This aneurysm was enhancing (CR=0.76). TAWSS ranged from 5.46 to 494.90 dynes/cm2 (figure 2K–O and online supplemental video 1). VMS values ranged from 0.0089 to 1.40 MPa on FEA. TAWSS and VMS were uniformly distributed in the aneurysmal wall. The transition zone—where the normal vessel widens to 1.5 the normal maximal diameter—exhibited lower TAWSS, higher OSI and a localized, maximal VMS area (1.40 MPa). Additionally, on the posterior wall of the aneurysm, a focal area of increased OSI (0.37) and multiple areas of high TAWSS were noted.
Discussion
Fusiform aneurysms enhanced more than saccular aneurysms, mainly because of their larger diameter and volume. Patients with enhancing fusiform aneurysms also displayed increased enhancement of other vessels in the circle of Willis, suggesting an underlying cerebral vasculopathy. Approximately 50% of fusiform aneurysms analyzed had microhemorrhages at the interface of the aneurysm wall and brain tissue. Only 80% of these aneurysms had mural thrombus identified by conventional imaging (high T1 signal). These aneurysms also had increased wall enhancement. Different types of fusiform aneurysms exhibited a wide variety of TAWSS and FEA.
Pathogenesis of fusiform aneurysms
The pathogenesis of fusiform aneurysms appears to be different from that of saccular aneurysms.3–5 Vascular processes, such as dissection, atherosclerosis, disorders of collagen and elastin metabolism, infections, and sometimes neoplastic invasion of the arterial wall, can lead to the formation of fusiform aneurysms.3 5 21 Fusiform aneurysms result from the pathological involvement of the entire artery, underlying vasculopathy as possible etiology, as opposed to saccular aneurysms, which are usually the result of an interplay of blood flow disturbances and inflammatory endothelial damage.22
Fusiform aneurysm enhancement
Fusiform aneurysms enhanced more than saccular aneurysms. Moreover, vessels of other vascular territories of patients with fusiform enhancing aneurysms also exhibited increased contrast enhancement. This was apparent in some patients with large fusiform VB aneurysms (online supplemental figure e-3). The specific mechanism of aneurysm wall enhancement remains unclear. However, histological studies show that thickened wall accompanied by atherosclerosis, neovascularization, and macrophage infiltration may play an important role in the pathophysiology of aneurysm wall enhancement.23 24 Samaniego et al described a correlation between saccular aneurysm wall enhancement and parent vessel wall enhancement using 7T-MRI, suggesting that inflammatory processes of the arterial wall may ultimately lead to aneurysm formation.25 Diffuse arterial enhancement is highly suggestive of an underlying vasculopathy that may result in arterial dilatation and fusiform aneurysm formation. Liu et al also described greater enhancement of fusiform aneurysms as compared with saccular aneurysms (1.41±0.51 vs 0.96±0.36,p=0.01).26 In analyzing 11 fusiform aneurysms with 7T-MRI, they found that 10 aneurysms had uniform aneurysm wall enhancement.26 The authors argue that the presence of uniform enhancement along the aneurysm wall is highly suggestive of a vasculopathy that harbors a more diffuse pathology. We confirmed the diffuse wall enhancement of fusiform aneurysms in comparison with saccular aneurysms (mean CR=0.90±0.17 vs 0.41±0.13, p<0.001). Additionally, the increased enhancement of other vessels in the circle of Willis of patients with highly enhancing fusiform aneurysms further suggests a diffuse vasculopathy encompassing the vasculature outside of the immediate fusiform dilatation. Zhu et al also reported increased vessel wall enhancement in a series of 21 VB dissecting fusiform aneurysms.27 We found that fusiform morphology, based on Flemming’s classification, was associated with enhancement. Nasr et al also described that fusiform or transitional morphology had a strong association with aneurysm growth and/or rupture.7
In multivariable analysis the best predictor of aneurysm enhancement was larger diameter and volume. Cao et al analyzed the enhancement pattern of 34 non-saccular VB aneurysms. In their multivariable analysis, maximal diameter (OR=1.41, 95% CI 1.08 to 1.84, p=0.013) and CR (OR=9.83, 95% CI 2.68 to 36.12, p=0.037) were associated with clinical symptoms.28 Interestingly, the CR value reported by Cao et al was similar to our CR value—namely, 0.88±0.21 and 0.86±0.34, respectively. Nasr et al retrospectively analyzed 45 fusiform VB aneurysms with a mean follow-up of 3.6 years.7 Variables associated with growth and rupture on univariate analysis were size >10 mm (57.6% vs 16.0%, p<0.0001), mural T1 signal (39.7% vs 16.3%, p=0.001), daughter sac (56.3% vs 21.3%), and mural thrombus (45.5% vs 13.4%, p<0.0001). These studies suggest that larger enhancing fusiform aneurysms should be closely monitored as they are more likely to enlarge and rupture. The studies of Cao and Nasr focused on VB fusiform aneurysms; we included fusiform aneurysms located in the anterior circulation as well (37.5%). We found no specific relationship between aneurysm wall enhancement and/or QSM analysis based on location: anterior versus posterior circulations.
Microhemorrhage
For the first time QSM has been described in determining the presence of mural microhemorrhages in fusiform aneurysms. Mural thrombosis, detected by high T1 signal, has been described as a morphological feature of aneurysm instability.7 QSM may be a more sensitive and specific method for detecting mural hemorrhages. The use of QSM imaging allowed identification of an additional 20% of microhemorrhages as compared with the presence of mural thrombus seen on T1 (p=0.009). Additionally, four of the five enhancing aneurysms had microhemorrhage, while none of the non-enhancing aneurysms had microhemorrhage. This suggests that enhancing fusiform aneurysms have a higher likelihood of hemorrhage and that enhancement is a sign of instability. Biological processes that affect the wall of fusiform aneurysms include inflammation, microhemorrhage, proliferation of the vasa vasorum, and ultimately, growth and rupture.5 QSM coupled with wall enhancement may be used in assessing the risk of aneurysm growth and rupture. The pathological study by Mizutani et al showed that dolichoectatic dissecting VB aneurysms undergo fragmentation of the internal elastic lamina combined with multiple dissections of the thickened intima.8 Thrombus formation was common at the site of intimal dissection. We hypothesize that these microhemorrhages may sometimes extend to the outer boundaries of the aneurysm wall and may be detected with QSM. Mural thrombosis occurs more frequently in fusiform aneurysm (29%) than in saccular aneurysms (9%).29 In our cohort, 13 of the 24 fusiform aneurysm presented with mural thrombosis, and nine were enhancing. The increased enhancement in thrombosed aneurysms may be attributed to formation of the vasa vasorum in the outer aneurysmal wall or due to a neovascularization process occurring in the inner wall layer.5 30 The poor natural history of aneurysms with mural thrombosis could be explained by the fact that partially thrombosed aneurysms are generally larger and are probably characterized by recurrent subacute and non-transmural dissections, which result in progressive enlargement.5 7 Avid enhancement of fusiform aneurysms may entail higher likelihood of growth and rupture.
Computational analysis
Detailed analysis of flow dynamic features and wall tension of fusiform aneurysms demonstrated the broad spectrum of processes that might affect their pathophysiology. Patient 1 exemplifies two non-atherosclerotic dolichoectatic fusiform VB aneurysms (Mizutani three and Flemming transitional). No correlation was found between focal areas of TAWSS, OSI, and VMS in the proximal and distal aneurysms of this patient. This suggests that mechanical stresses do not play a central role in the formation and growth of these fusiform aneurysms. The distal aneurysm had similar diameter and volume to the proximal aneurysm, despite exhibiting lower WSS. The distribution of wall tension in these aneurysms suggests that it is unlikely that supraphysiologic pressure loading along the arterial wall plays a role in their formation and growth. Similar isotropic behavior of wall tension distribution has been described in aortic aneurysms.31 These findings underscore that some fusiform aneurysms result from an underlying vasculopathy such as atherosclerosis and/or inflammatory processes. Saccular areas of low flow did not overlap with areas of increased enhancement. This argues against the pseudo-enhancement of the aneurysm wall described by other groups.32 Moreover, the entire circle of Willis was enhanced in some of these aneurysms (online supplemental figure e-3). Low-flow conditions would not explain this phenomenon. Of interest, this patient had systemic lupus erythematosus (SLE) and exhibited diffusely enhancing cerebral vessels, with a RV CR of 0.98. Ide et al described increased vascular thickening of the ICA, VA, and BA trunk in comparing 60 patients with SLE with 50 healthy controls.33 The authors argued that the concentric vascular thickening of patients with SLE may represent a vasculitis.33
Patient 2 represents another category of fusiform aneurysm: wide base with saccular component in the dome (Mizutani type 4 and Flemming fusiform). The saccular dome that projects from the fusiform sac demonstrates prominent overlap with areas of high TAWSS (figure 2, panel G, arrow) and low VMS (figure 2, panel I, arrow). Increased WSS has been previously associated with areas of growth in saccular aneurysms but has not been directly associated with rupture risk.34 In a study of 97 saccular intracranial aneurysms, Salimi Ashkezari et al demonstrated that bleb wall characteristics (thin vs thick/atherosclerotic) may be influenced by their position relative to the aneurysm inflow, where thin walls tend to arise near the inflow while experiencing higher wall shear stress.35 In this scenario, this type of fusiform aneurysm may grow like certain saccular aneurysms, with areas of growth occurring at the neck owing to increased WSS. This focal area of high TAWSS, low VMS, and no enhancement may suggest an area of decreased rupture risk, but of active growth.36
The third patient represents the fusiform, enhancing, and atherosclerotic dilatation of the VB system (Mizutami does not apply and Flemming transitional). The inflow of the aneurysm demonstrates a pattern of localized VMS (figure 2, panel N, arrow) and low TAWSS (figure 2, panel I, arrow). The posterior wall of the aneurysm sac shows a focal area of maximal OSI which correlates with high vorticity (figure 2, panel M, arrow). High OSI has been associated with the development of atherosclerotic plaques.37 The high levels of enhancement may be related to the atherosclerosis that was found throughout the aneurysm, and which was probably worsened by poorly controlled diabetes, hypertension, and hyperlipidemia. Previous studies have suggested the formation of vasa vasorum due to the continuous remodeling and atherosclerosis. Vasa vasorum is linked with vessel enhancement on MRI, further supporting an underlying vasculopathy as the source of enhancement in the aneurysm wall.5 23 In this particular fusiform aneurysm, morphological features are driven by atherosclerosis that leads to areas of different wall thickness, microdissections, proliferation of vasa vasorum, continued inflammation, and intimal changes.38
Limitations
The primary limitation of this study is the small sample size. This is a single-center, cross-sectional study with limited follow-up imaging. Second, computational analysis was performed only for three subjects with four differing fusiform aneurysms. However, these aneurysms are the most representative fusiform aneurysms of this cohort. This study does not include histopathology to correlate with our imaging findings. Another limitation, which might be a strength of this study, is the inclusion of dissecting and atherosclerotic fusiform aneurysms. We based our inclusion criteria on morphological parameters (1.5 x normal diameter of the parent vessel). We believe this assessment is clinically more feasible, as the presence of mild atherosclerotic changes or mini-dissections may not be routinely identified with conventional imaging.
Conclusion
This study demonstrates significant differences between fusiform and saccular aneurysms, while highlighting morphological characteristics that are unique to fusiform aneurysms. Fusiform aneurysms enhance more than saccular aneurysms, mainly because of larger diameter and volume. Moreover, other arteries of the circle of Willis in patients with enhancing fusiform aneurysms displayed higher enhancement than those with non-enhancing fusiform aneurysms, suggesting an underlying cerebral vasculopathy as the main process involved in the pathogenesis of these aneurysms. Enhancing aneurysms were also more likely than non-enhancing aneurysms to have microhemorrhage at the interface of the aneurysm wall and brain tissue. Different types of fusiform aneurysms display different patterns of WSS and FEA, suggesting that fusiform morphology is the result of multiple pathomechanic processes. Current classifications of fusiform aneurysms should include HR-MRI features of instability.
Data availability statement
All data relevant to the study are included in the article or uploaded as supplementary information. Raw data were generated at the University of Iowa. Derived data supporting the findings of this study are available from the corresponding author EAS, on request.
Ethics statements
Patient consent for publication
Ethics approval
University of Iowa - IRB01 / IRB ID #201803866201803866.
References
Supplementary materials
Supplementary Data
This web only file has been produced by the BMJ Publishing Group from an electronic file supplied by the author(s) and has not been edited for content.
Footnotes
Contributors Conception and study design: EAS. Acquisition of data: RPS, AV, AR, MN, AEG, and DP. Analysis and interpretation of results: RPS, AV, MN, AEG, MLR, and EAS. Drafting of the manuscript: RPS, AV, AR, DP, and EAS. Critical revision of the study: MLR, DH, and EAS. Funding Acquisition: EAS. All authors contributed to the continuous refinement of the study protocol and approved the final manuscript.
Funding This work was supported by the The Bee Foundation and by the 2019 Brain Aneurysm Research grant and the 'Society of Vascular and Interventional Neurology'' (SVIN) pilot research grant to EAS. This work was conducted on an MRI instrument funded by 1S10RR028821-01.
Competing interests None declared.
Provenance and peer review Not commissioned; externally peer reviewed.
Supplemental material This content has been supplied by the author(s). It has not been vetted by BMJ Publishing Group Limited (BMJ) and may not have been peer-reviewed. Any opinions or recommendations discussed are solely those of the author(s) and are not endorsed by BMJ. BMJ disclaims all liability and responsibility arising from any reliance placed on the content. Where the content includes any translated material, BMJ does not warrant the accuracy and reliability of the translations (including but not limited to local regulations, clinical guidelines, terminology, drug names and drug dosages), and is not responsible for any error and/or omissions arising from translation and adaptation or otherwise.