Article Text

Abstract
Background The micro-architectonics of the subarachnoid space (SAS) remain partially understood and largely ignored, likely the result of the inability to image these structures in vivo. We explored transvascular imaging with high-frequency optical coherence tomography (HF-OCT) to interrogate the SAS.
Methods In vivo HF-OCT was performed in 10 dogs in both the posterior and anterior cerebral circulations. The conduit vessels used were the basilar, anterior spinal, and middle and anterior cerebral arteries through which the perivascular SAS was imaged. The HF-OCT imaging probe was introduced via a microcatheter and images were acquired using a contrast injection (3.5 mL/s) for blood clearance. Segmentation and three-dimensional rendering of HF-OCT images were performed to study the different configurations and porosity of the subarachnoid trabeculae (SAT) as a function of location.
Results Of 13 acquisitions, three were excluded due to suboptimal image quality. Analysis of 15 locations from seven animals was performed showing six distinct configurations of arachnoid structures in the posterior circulation and middle cerebral artery, ranging from minimal presence of SAT to dense networks and membranes. Different locations showed predilection for specific arachnoid morphologies. At the basilar bifurcation, a thick, fenestrated membrane had a unique morphology. SAT average thickness was 100 µm and did not vary significantly based on location. Similarly, the porosity of the SAT averaged 91% and showed low variability.
Conclusion We have demonstrated the feasibility to image the structures of the SAS with transvascular HF-OCT. Future studies are planned to further map the SAT to increase our understanding of their function and possible impact on neurovascular pathologies.
- device
- intervention
- technology
- hydrocephalus
- vessel wall
Data availability statement
Data are available upon reasonable request. Data are available by contacting the corresponding author.
Statistics from Altmetric.com
Introduction
In the last decades much has changed regarding our understanding of the layers covering the brain and spinal cord and their intervening spaces. In ancient times, only two membranes covering the brain were identified, the dura mater and the pia mater.1 It was not until the 17th century that the arachnoid membrane was described by Gerardus Blasius for the first time, and consecutively by Frederick Ruysch who illustrated its cobweb appearance by blowing air under it.2 Axel Henrik Key and Magnus Retzius set the foundations for later studies on subarachnoid cisterns and membranes with their landmark work. In 1875 they demonstrated the extensions and divisions of the subarachnoid system and provided detailed diagrams of the subarachnoid spaces and trabeculae.3 Despite tremendous progress in imaging techniques and image quality, currently available imaging modalities like computed tomography (CT), ultrasonography, and magnetic resonance imaging (MRI) still lack the spatial resolution and contrast to image the fine anatomical details of the subarachnoid space (SAS). Apart from thicker arachnoid membranes in specific anatomical locations, like the Liliequist membrane, that can be seen with MRI4; the majority of trabecular structures located in the SAS remain unrecognized with conventional imaging.
Optical coherence tomography (OCT) is an imaging modality able to produce high-resolution images of different types of tissue using low coherence lasers and interferometry techniques to visualize tissue microstructure from its optical properties.5 6 Intravascular OCT provides detailed images of the vessel wall comparable to histology.7 8 High-frequency OCT (HF-OCT) is a new generation imaging technology, specifically designed for neurovascular applications.9 The low profile (1.2F), flexible imaging catheter is designed to image highly tortuous vasculature, provide artifact-free image quality, and to ensure compatibility with microcatheterization; the increased field of view (ie, imaging diameter of 14 mm) combined with an image resolution approaching 10 μm presents substantial advantages for neurovascular imaging applications.9–11
In this study, we hypothesized that the spatial resolution of HF-OCT and the optical properties of the cerebrospinal fluid (CSF) and vessel wall would allow imaging of the SAS surrounding the large intracranial and intrathecal vessels. The aim was to employ a preclinical model where the intracranial vessels and, secondarily, the anterior spinal artery (ASA) could act as a conduit for catheter navigation and HF-OCT-probe placement, enabling imaging of the perivascular structures of the SAS through the vessel wall. The study goal was to investigate in a minimally invasive manner the micro-architectonics of the SAS in key locations in vivo, including the basal cisterns, the ventral aspect of the posterior fossa and spinal cord, the Sylvian cistern, and the cisterns around the anterior communicating artery (Acom) complex.
Materials and methods
All experimental procedures performed were approved by our Institutional Animal Care and Use Committee. Ten hound cross dogs were used for the purposes of the current study (sex: n=8 females, mean age: 8 months, mean weight: 18.82 kg). Before all procedures, the animals were pre-anesthetized by an intramuscular injection of glycopyrrolate (0.01 mg/kg), acepromazine (0.06 mg/kg), and buprenorphine (0.02 mg/kg). Anesthesia was induced by an intravenous injection of propofol (3–4 mg/kg) and maintained with mechanical ventilation of 1–3% isoflurane in oxygen (tidal volume 8–10 mL/kg; peak airway pressure <20 cm H2O). The physiological status of each animal was continuously monitored and documented every 15 min.
Multiple pullbacks are possible in each animal; however, in our study we practiced the Russell and Burch 3R’s of animal research12 by performing HF-OCT in dogs that had received various endovascular implants in standard studies of efficacy and safety unrelated to this report. The number of HF-OCT pullbacks was selected to minimize the impact on implant studies and maintain total contrast volume below 7 mL/kg/hour as required by our approved protocol.
Each animal was placed in a supine position on the angiosurgical table, and the femoral artery was surgically exposed. Arterial access was achieved using a modified Seldinger technique followed by placement of an 9 French (9F) arterial sheath. A long 6F sheath (Cook Medical, Bloomington, IN) was placed either in the subclavian artery and just proximal to the orifice of the dominant vertebral artery (VA) for the posterior circulation, or in the common carotid artery (CCA) proximal to the orifice of the internal carotid artery (ICA) for the anterior circulation. Angiography was obtained in order to assess the anatomy, a proper projection was chosen, and a roadmap was used for catheter navigation.
Posterior circulation: A distal access catheter (DAC 057, Stryker Neurovascular, Fremont, CA) was positioned into the dominant VA up to the origin of the lateral anastomotic ramus that terminates in the ASA. A microcatheter, either an SL-10 (Stryker Neurovascular) or a Headway Duo (1.6F, MicroVention, Irvine, CA), was navigated through the lateral anastomotic ramus into the ASA through the basilar artery (BA) with the final position either in the posterior communicating artery (Pcom), the posterior cerebral artery (PCA) or the superior cerebellar artery (SCA) (online supplemental figure 1).
Anterior circulation: A distal access catheter (either DAC 044 or a Catalyst 5, Stryker Neurovascular) was positioned inside the proximal ICA. A microcatheter Headway Duo (1.6F) was navigated through the ICA up to the ICA terminus. Then it was directed into the middle cerebral artery (MCA) and up to the distal M2/proximal M3 segment of either the superior or inferior division for imaging along the circular sulcus, Sylvian fissure, and MCA. In one case where imaging of the anterior communicating complex (Acom complex) was attempted, the microcatheter was navigated from the left ICA terminus into the left A1 segment, through the Acom and finally into the right A1 segment and retrograde into the contralateral ICA (figure 1).
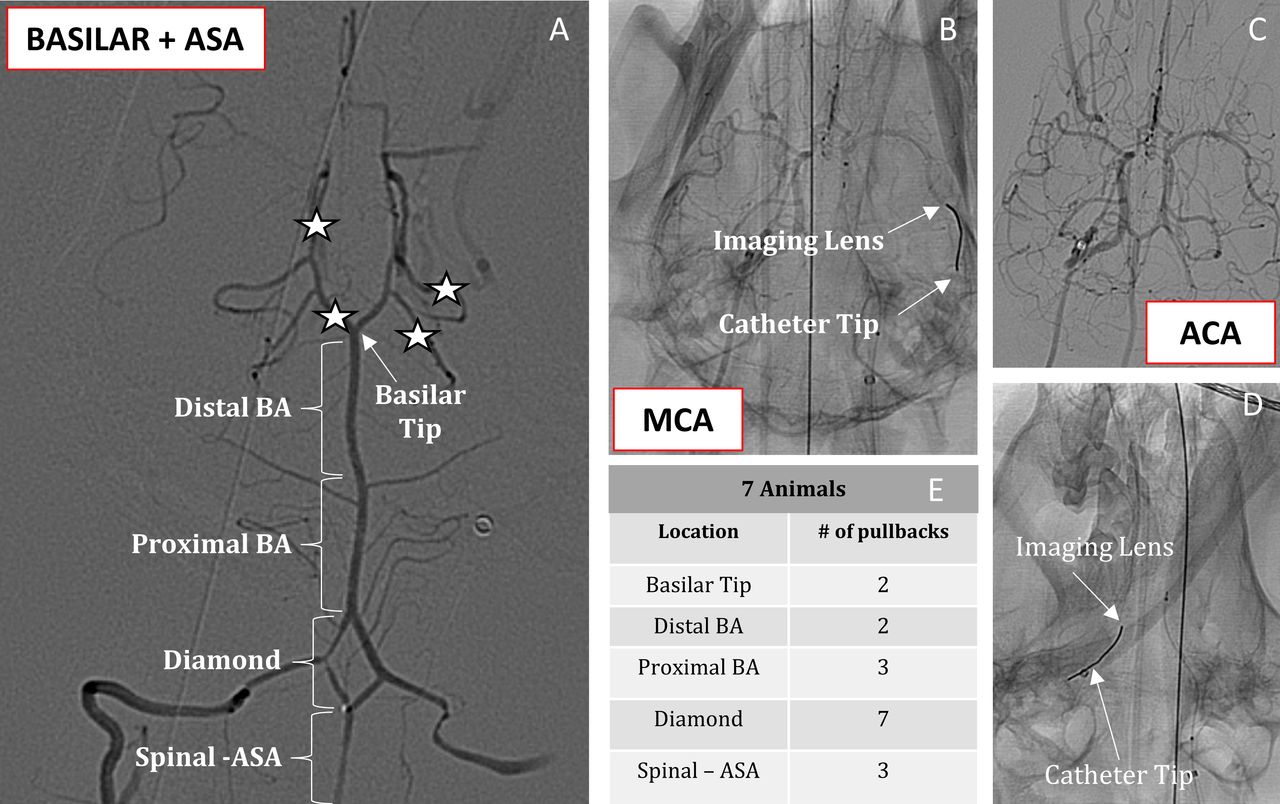
Different locations of high-frequency optical coherence tomography (HF-OCT) probe placement. (A.1) Basilar and anterior spinal artery (ASA). asterisks depict all the different locations the probe was placed (posterior communicating artery, P1 segment, P2 segment, superior cerebellar artery). The five different areas that we analyzed are also shown (basilar tip, distal and proximal basilar artery, diamond, spinal ASA). (B) Middle cerebral artery (MCA). HF-OCT shown with the distal tip in the M3 segment of the left MCA. (C, D) Anterior cerebral artery. Angiographic image of the whole intracranial circulation and HF-OCT probe positioned from the left internal carotid artery through left A1 segment and anterior communicating artery to the contralateral A1 segment and internal carotid artery. Arrows in images (B) and (D) show the distal catheter tip and the position of the imaging lens. (E) The number of pullbacks for each location in the seven animals with imaging of the posterior circulation.
HF-OCT imaging
The HF-OCT system (Vis-M, Gentuity, Sudbury, MA) used in our lab and for the purposes of this experiment consists of an 0.015 inch imaging probe with similar characteristics to a microwire.9 The tip of the probe has a microwire-like flexible and shapeable tip 1.5 cm long, attached to the main body of the probe and just distal to the incorporated imaging lens. With the microcatheter at the desired location, the imaging probe was advanced through the microcatheter up to the microcatheter tip. The microcatheter was then withdrawn and brought proximal to the HF-OCT imaging lens, while ensuring that the tip of the probe remained stable at the initial location. Digital subtraction angiography or fluoroscopy was captured into the HF-OCT system during each pullback. The larger and visible vessels seen during angiography or fluoroscopy were mapped on the HF-OCT pullback and the exact anatomical levels of each HF-OCT image determined. A contrast injection with an automatic injector (3.5 mL/s, 4 s) through the distal access catheter was performed to clear the blood during HF-OCT imaging. A pullback was initiated when visible blood clearance of vessel lumen was observed on the console monitor. HF-OCT data were acquired in A-scan lines (200 000 A-scan lines per second). In these experiments, in Cartesian coordinates, we estimated that x (axial resolution) approached ~10 µm, y (lateral resolution) at the focal length was <40 µm resolution, and the z resolution (ie, frame spacing) at approximately 50 µm, depending on exact user selected pullback speed (frame rate is equal to 250 cross-sectional images per second).
Image analysis
The HF-OCT console has the ability to tailor acquisition lengths for the desired target (up to 100 mm of vessel length). We elected to use two acquisition lengths of 4 or 5 cm, generating up to 750 images per pullback. Cross-sectional images and longitudinal two-dimensional (2D) projections were assessed for image quality; pullbacks showing poor quality were excluded from further analysis. The remaining datasets, showing regions with distinct trabecular structures and membranes, were further analyzed and three-dimensional (3D) reconstructions were generated.
HF-OCT 2D cross-sectional images were further aligned using a maximum gray-level energy-based MATLAB code (see online supplemental materials). Aligned pullbacks were rendered as a 3D volume so that the morphologies of the various trabecular structures could more easily be identified and classified. All further processing described below was performed using ImageJ 1.53 (NIH) and reconstructions obtained using ImageJ volume viewer toolbox. Color renderings were produced by manually segmenting the HF-OCT images. The desired structures (blood vessels, parenchyma, trabecular fibers and membranes, dura, and bony structures) were labeled and cut out of each slide producing a set of images without the specific structure. The structure of interest was subtracted from the original image resulting in a set of images retaining only the desired structure obtained. All the segmented structures were arranged using different color channels and rendered in 3D (see detail in online supplemental material).
Supplemental material
The porosity of the subarachnoid trabeculae (SAT) was measured by calculating the void to volume ratio of the scanned regions. Pullbacks were resliced into 100 longitudinal slices from which the space between the dura and the pia, excluding all non-SAT structures, was segmented and binarized. This space was then inverted and subtracted from the original to leave only the SAT which was also binarized. Finally, the sum of all SAT slices was divided by the sum of the space between the pia and dura, and subtracted from 100 to calculate the porosity percentage (see online supplemental material). The thickness of the SAT was manually measured from the unprocessed images by sampling one in every 10 slices.
Statistical analysis
Due to the small sample size, non-parametric Kruskal-Wallis tests were performed in MATLAB (R20201b) with a significance level set at 0.05.
Results
In total, 13 pullbacks were performed in 10 animals. Eight pullbacks were performed in the posterior circulation covering levels from either the Pcom, P1 segment or proximal SCA up to the proximal ASA at the mid cervical level (see example in online supplemental video). One pullback was attempted in the Acom area covering both A1 segments and the Acom. Four pullbacks were performed in either the right or left MCA from the M2 segment to the distal ICA. Three of the pullbacks were suboptimal due to either small subarachnoid bleeds or technical issues (table 1). There was a learning curve to perform HF-OCT in the intracranial vasculature of the dog as the first two cases were suboptimal. In the first case, there was inadequate clearance of blood to acquire the images as we refined our catheter set-up and contrast injection settings. In the second case, the imaging probe prototype which had been used in multiple experiments (not the intended clinical use) was damaged such that the probe optical lens assembly no longer worked as designed and was unable to properly focus and collect reflected light from the tissue. The third failure was due to an iatrogenic perforation during selective microcatheterization unrelated to HF-OCT acquisition. The resulting subarachnoid hemorrhage, although minor, led to erythrocytes in the SAS that attenuated the near-infrared light obscuring visualization of the SAT.
Supplementary video
Exact locations and number of pullbacks performed per animal. The excluded acquisitions are labeled as suboptimal
The arachnoid membranes and trabeculae with their relationships to the arteries were recognized in fine detail. Additionally, it was possible to visualize the large arteries of posterior and anterior circulations, their branches, and perforators (the smallest of which was 0.08 mm) (online supplemental figure 6). Occasionally nerve roots could be recognized as well as venous structures (online supplemental figure 5). We were able to isolate the different anatomical structures and separate the bony elements and dura matter, the parenchyma, the vessels and trabecular network along the entire pullback (figure 2).

Three-dimensional (3D) reconstructions of an entire pullback from the proximal basilar artery to the proximal cervical anterior spinal artery. (A–C) High-frequency optical coherence tomography images before segmentation. (D, E) Segmented 3D visualization. The dura matter and bony structure are colored in blue, the arteries in red, the parenchyma in yellow and the subarachnoid trabeculae (SAT) in green. (F–H) Different areas in the pullback are shown separately and as combined 3D images where the relationship of the SAT with the arteries and surrounding structures can be appreciated. (I) Number of connections of SAT to the main arteries at the explored locations. (J) Porosity of SAT at the explored locations as defined by void to volume ratio. MCA, middle cerebral artery.
Specific key locations of the posterior fossa and spinal level were segmented and rendered in 3D to better investigate the relationship between the arachnoid structures and the arteries. We divided the axis into the following four locations: distal basilar (distal half of the BA), proximal basilar (proximal half of the BA), diamond (the anastomotic network at the craniocervical junction connecting the ASA, BA, and VA), and spinal (cervical ASA at C1–C2 level). Analysis of 15 locations from seven animals were performed (figure 1) and six distinct configurations of arachnoid structures connecting to the vessels, pia and arachnoid were identified.
Arachnoid and trabecular configurations
Membrane: relatively thick uniform layer of tissue running along the artery, parallel to the arachnoid, with either direct attachment to the artery or through an intermediate network (figure 3A).
Loose trabecular network: lose network of trabecular fibers interconnecting with each other, directly attaching to the vessel, the pia matter and outer arachnoid (Figure 3B).
Dense trabecular network: dense network of trabecular fibers interconnecting with each other, directly attaching to the vessel, the pia matter and outer arachnoid (Figure 3C).
Cobweb: thin perforated film of tissue with similar orientation as the networks (figure 3D)
Unsupported: areas with few or no trabecular fibers (figure 3E).
Cross-connections: fibers running between two networks or cobwebs that grow out of the branches of a bifurcation (figure 3F).
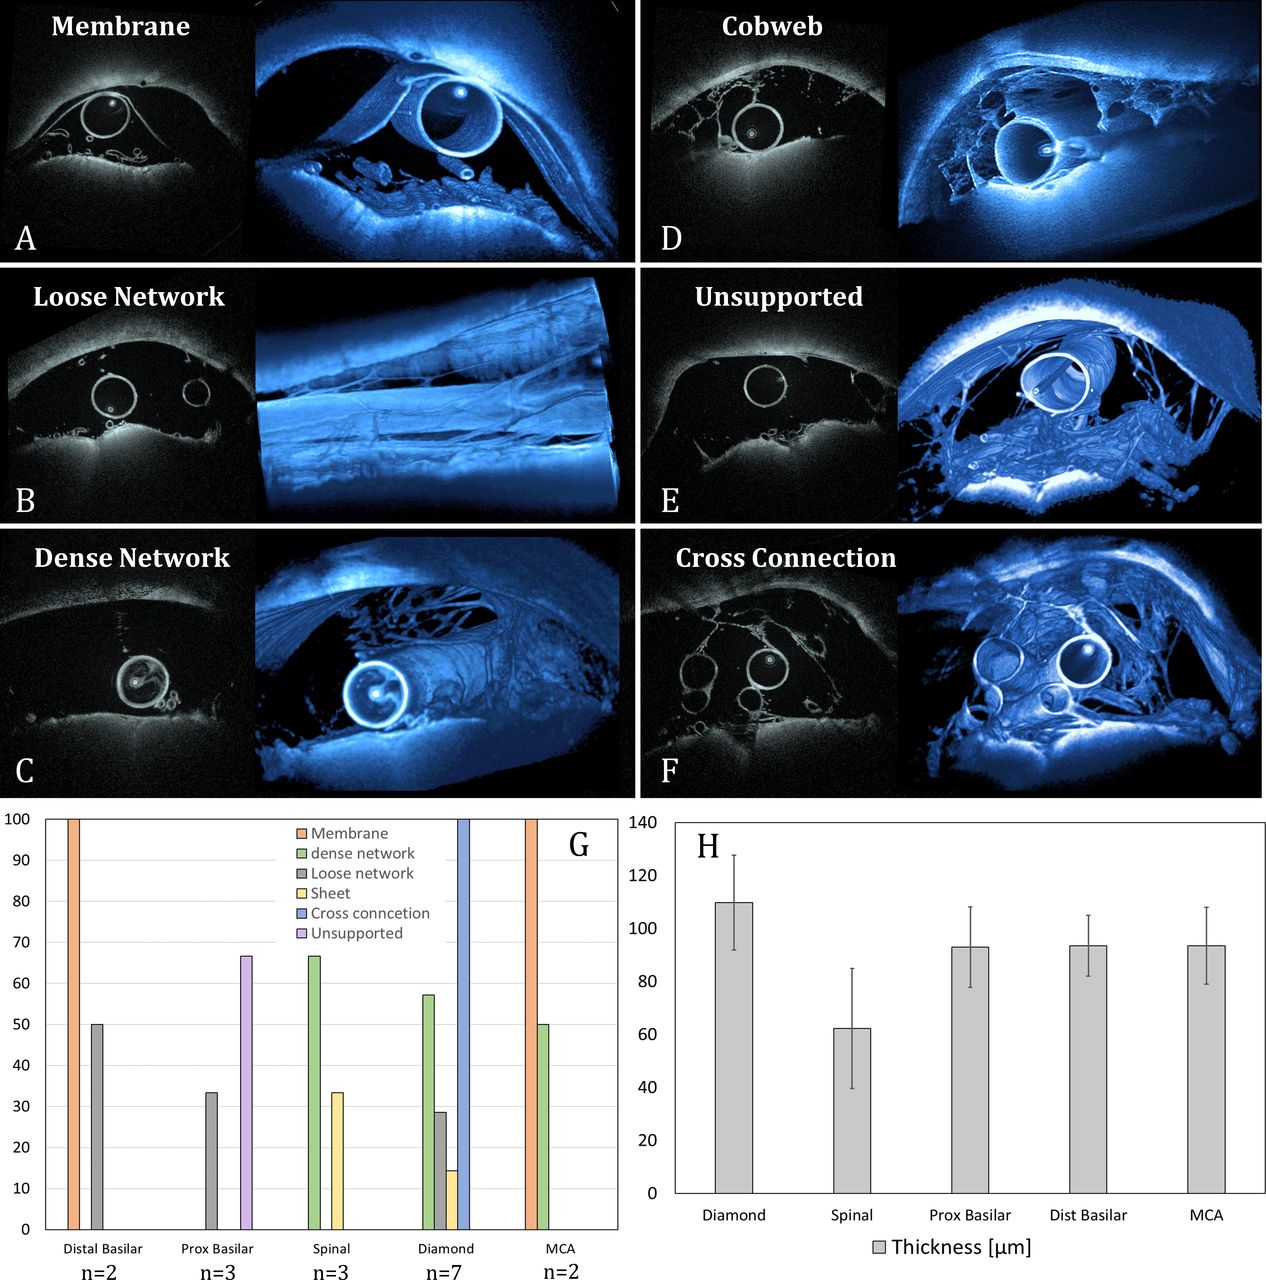
The different arachnoid and trabecular configurations generated from our image analysis are shown in two-dimensional and three-dimensional images. (A) The membrane represents a continuous solid structure touching the artery. (B, C) The loose and dense networks represent networks of trabecular fibers which differ in the amount of fibers present, interconnecting with each other, directly attaching to the vessel, the pia matter and outer arachnoid. (D) The cobweb configuration shows a multi-fenestrated thinner tissue than the membrane film of tissue attaching to the artery and parenchyma. (E) Unsupported is defined as areas with few or absent trabecular fibers. (F) Cross-connections represent fibers running between two networks or cobweb configurations growing mostly out of the branches of a bifurcation. (G) Frequency of shape occurrences according to location. (H) Distribution of subarachnoid trabecular thickness according to location. MCA, middle cerebral artery.
Specific locations showed a predominance of specific arachnoid morphologies. Loose network was found in 50% of the distal BA, 33.3% of the proximal BA, and 28.6% of the diamond. Dense network and cobweb configuration was found in the diamond and ASA level (dense in 57.1% and 66.6% of diamond and ASA, respectively; cobweb in 14.3% and 33.3% of diamond and ASA, respectively). The distal basilar and the MCA showed the presence of a membrane in all cases either touching the artery directly or through a loose network. For the MCA specifically, the membrane covered multiple branches connecting to each branch with membranous extensions while thinner trabecular fibers gave connections between the membrane and outer arachnoid. The proximal basilar fell in the unsupported category in 66.6% of the cases. Cross-connections were found in 100% of the diamonds. In proximity to some major arterial bifurcations, trabeculae stitching between branches of a bifurcation with thin string-like fibers were found, attaching between branches of the bifurcation holding them together (figure 4). The thickness of the SAT membranes we were able to measure ranged from 20 µm to 300 µm with an average of 100 µm and showed no statistically significant differences between the analyzed locations (figure 3H). The thickest SAT appeared at the attachment points to the arterial wall while the thinnest were fibers running inside the CSF space. At the level of the basilar tip, a characteristic morphology of a thicker fenestrated membrane attaching close to the basilar tip and extending distally was found. The membrane had an average thickness of 550 µm and a maximum width of approximately 2 mm. Due to its unique morphology and appearance in the specific locations it was excluded from the overall calculation of SAT thickness.

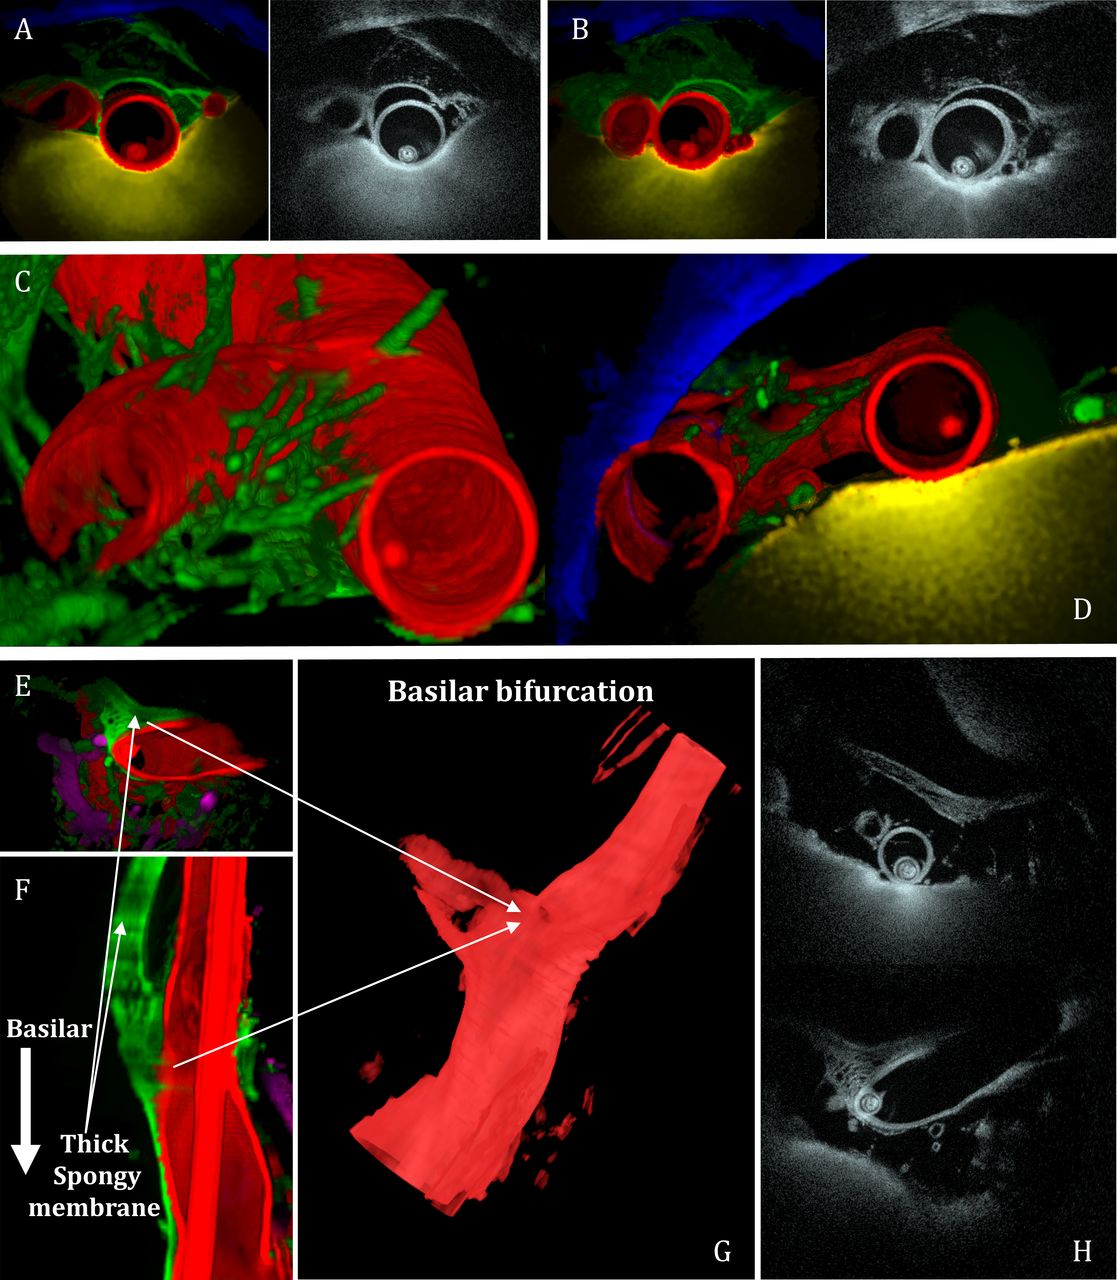
(A, B) Three-dimensional (3D) colored and two-dimensional (2D) high-frequency optical coherence tomography images from the same levels of a middle cerebral artery (MCA) bifurcation from distal to proximal. A membrane covering the branches of the MCA is shown attaching to the vessel as well as to the outer arachnoid with thinner trabecular fibers. (C, D) 3D reconstructed images showing multiple thin fibers arising from the proximity of a major arterial bifurcation attaching and holding the branches together. (E, F) The characteristic morphology of a relatively thick micro-fenestrated membrane located at the basilar tip. Points of attachment are shown in 3D reformats. (G) The micro-fenestrated morphology can be better appreciated in the 2D images.
Similar to the thickness, the porosity of the SAT showed low variability averaging at 91% with a minimum of 71% at the MCA and a maximum of 97% at the proximal basilar region. However, the number of SAT connections to the main arteries varied based on location, with a minimum of zero connections at the proximal basilar artery (average 4) and a maximum of 15 at a distal basilar (average 9) (figure 2F).
Discussion
We discovered that HF-OCT is capable of in vivo imaging of the micro-architectonics of subarachnoid spaces located at the base of the brain, in the basal cisterns, Sylvian cistern, ventral aspect of the posterior cranial fossa, and the spinal cord. Major cerebral vessels were used as a window towards the SAS to image the arachnoid structures and their relationships to the arteries and surrounding tissue in high resolution. The CSF has favorable optical characteristics that enable HF-OCT to depict the fine elements of the SAS. First-in-man use of HF-OCT is imminent, and as clinical experience grows, we speculate the implications of imaging the SAT may provide insights on the perivascular SAT relationship with brain aneurysms, inform models of traumatic brain injury, and potentially reveal mechanisms of communicating hydrocephalus (discussed further below).
The structural components of the SAS consist of arachnoid trabeculae and arachnoid membranes. They traverse the space and the cisterns and divide the CSF filled area into compartments. The arachnoid trabeculae are fine cobweb structures of sheets or columns of collagen, surrounded by leptomeningeal cells which extend across the SAS from the arachnoid to the pia, travel to the subpial collagen network and attach to the glia.13–15 They enclose small blood vessels and adhere on the surface of larger ones.16 17 They can also adhere to nerves within the space mainly in the cisterna magna, which are believed to convey information about CSF pressure.18 Tracers injected into the cerebrum of rats have been shown to drain into the cores of trabeculae traversing the SAS, suggesting that interstitial fluid from the brain may drain along the perivascular spaces, through the subpial space and into trabeculae.15 From an embryological point of view, trabeculae are remnants of a subtraction process taking place in the early embryonic life when the framework of the SAS is being established.19–21 With the help of scanning electron microscopy and transmission electron microscopy, the histology and architecture of the trabeculae was further investigated, showing that trabeculae are mechanically strong, honeycomb-type structures consisting of type I collagen, have complex morphologies, show various shapes and organizations, and form networks mostly in the vicinity of blood vessels.22
Yasargil has published the most complete work on extensions and contents of the cisterns, has described the arachnoid membranes and their relationships with the contents of the cisterns, and has stressed the importance of properly incising these structures during microscopic neurosurgery.18 23 Detailed micro-anatomical studies of arachnoid membranes in human cadavers have consecutively been performed by other investigators where arachnoid and trabecular membranes have been described in different locations,24–29 but complete mapping of the SAS in vivo has not been performed. Although well-known by pathologists, anatomist and neurosurgeons for decades, these structures have been long ignored by other specialties. When arachnoid trabeculae and membranes are neglected, the modeling of the SAS becomes inaccurate, and the conclusions drawn concerning disease can often be misleading. Ignoring the presence of trabeculae changes the whole micro-architectonics of the SAS and that in turn affects fluid mechanics, circulation of CSF, the behavior of the brain under tension, and the way we understand trauma.30 31
Exploration of the convexial, cortical SAS with the use of OCT has been reported in the literature, with placement of the OCT probe directly on the arachnoid membrane following craniotomy. Studies with the use of external OCT probes have investigated the cortical SAS in piglets, measured the substructures of the pia-arachnoid complex, calculated the volume fraction of trabeculae in different areas of the brain and showed its high regional variability, suggesting that some areas are mechanically weaker than others with increased propensity for bleeding. Incorporation of the regional variability of the pia-arachnoid complex structures can alter substantially the distribution of stress on the cortical surfaces of the brain and improve prediction of hemorrhage.32 Incorporating spatial heterogeneity in computational models of traumatic brain injury may improve their accuracy and enhance the understanding of brain dynamics.33 In vivo imaging of the human cortical arachnoid trabeculae has been limited to one study where OCT was performed intraoperatively in the temporal and frontal lobes, indicating that OCT provides a dynamic tool for real-time imaging of the SAS at micrometer spatial resolution.34
In our current work, we were able to image in high resolution the arachnoid membranes in deep cisterns by using an intravascular HF-OCT with light penetrating the artery wall and looking through the vessels to study the SAS. We could depict fine details of trabecular branching, membrane fenestrations, denser and looser networks, or continuous membranes. We were able to follow the course of the arteries present in each pullback, their branching points, as well as entrance of perforating vessels into the brain or spinal parenchyma (online supplemental figure 2). At the level of the cord, we were able to differentiate between vasocorona and sulco-commissular arteries by observing their course of either surrounding or piercing the cord (online supplemental figure 3). Nerve roots could be recognized from their anatomical location in relation to the spinal cord (online supplemental figure 4).
Each anatomical level and location we investigated showed significant variability in the morphology and density of arachnoid trabeculae. Some areas showed abundance of fibers and others not, and arachnoid trabeculae ranged from dense and clustered to sparse and absent. Membranous configurations varied from solid and thick to porous and thin. It is known that areas with complex neurovascular structures have more complex and luxuriant membranes and trabeculae compared with areas with simple neurovascular structures.26 Heterogeneity both in the superficial subarachnoid and basal cisterns seems to be the rule in all anatomical studies. Some of the variations arise from the expected variability during embryogenesis, others from the type of study conducted and method being used.35 The volumes of trabeculae differ between subjects and locations. The exact etiology for this diversity has not been fully explored.
The arachnoid membranes and trabeculae support the neurovascular structures by attaching to vessels and nerves. As shown in our study, apart from attaching to vessel and nerves and forming connections between pia and arachnoid, they also show multiple connections between vessel branches, quite prominent at bifurcation points. This may account for irregular aneurysm morphology, with perivascular SAS fibers compressing the aneurysm wall during its growth. Like collagen elsewhere in the body, the subarachnoid trabeculae provide mechanical strength and structural support. They stabilize the brain tissue within the pia-arachnoid complex and can constrain the relative movement between skull and brain, possibly affecting traumatic brain injuries.36 37 A detailed analysis of finer subarachnoid trabecular geometries has revealed recently detailed shapes of dominant arachnoid trabeculae structures, each of which would have a different response to tensile loads and would provide different levels of resistance to CSF flow within the SAS.38
Investigation of the SAS surrounding the human optic nerve showed a complex, inhomogeneous system of trabeculae and septa which could contribute in CSF dynamics and pressure homeostasis between the SAS and the optic nerve, influencing retrolaminar pressures and thus playing a role in associated pathologies.39 The complex intrinsic arachnoid-trabecular organization found in the subarachnoid cisterns is believed to influence the morphology of unruptured aneurysms and the dynamic behavior of ruptured aneurysms observed during the acute phase of subarachnoid hemorrhage.40 It is also interesting that there seems to be some correlation between density of trabecular structures and aneurysm predilection for location. Crowded arachnoid structures are present around the bifurcation of the ICA, the area around the hypothalamus, which is located above the circle of Willis, the interpenducular cistern containing the basilar bifurcation, and the cisterna magna where the posterior inferior cerebellar artery is found.26 The arterial segments in these locations show a higher incidence of aneurysm formation than other arterial segments like the proximal basilar artery, where trabecular fibers are sparser as shown in our study as well. Aneurysm research has largely ignored perivascular structures, and the impact of the SAT in aneurysm pathophysiology has yet to be studied.
Our porosity calculations showed that the overall porosity in the analyzed areas is high, indicating little resistance to CSF circulation. However, the compartmentalization of the SAS from trabeculae and membranes could play a role in CSF flow. It has been shown that trabecular fibers produce various sized openings through which CSF freely flows in normal situations. In some cases, however, these openings can be smaller due to higher volumes of arachnoid tissue inside the cisterns which can lead to increased resistance to or even redirection of CSF flow.18 This would explain why some patients with post-inflammatory or post-hemorrhagic hydrocephalus thought of having communicating hydrocephalus respond to third ventriculostomy.41 It is also known that failed third ventriculostomies can occur from existing prepontine arachnoid trabeculae and an imperforated Liliequist membrane.42 A local increase in subarachnoid trabeculae distribution, after traumatic bleeding, aneurysmal subarachnoid hemorrhage, inflammatory or neoplastic infiltration, could be a cofactor of communicating hydrocephalus by altering the intracranial flow dynamics affecting interstitial fluid transport within the central nervous system.43 Topographic analysis and further investigation of structural features and geometric properties are needed for understanding the architectonics of the SAS in its entirety and consecutively shedding light on potential functionality of the fine elements located there.
Real-time high resolution in vivo imaging offers specific advantages. The anatomical elements and relationships of participating structures remain intact and retain their integrity, compared with surgical exposure or anatomical ex-vivo studies where at least parts of the structures are being peeled away, partially dissected or become difficult to study due to their fragility. This could alter the tissue dynamics and result in a loss of information. Imaging of the same area multiple times, at different time points and after specific interventions can be performed, giving the opportunity for comparisons. However, our study has limitations, primarily around technical challenges in microcatheterization of the tortuous, small and thinner vessels of the dog’s intracranial vasculature. Although these data suggest that imaging in the larger vessels of humans is feasible and safe, further clinical studies are required to identify utility. Additionally, in order to acquire transvascular imaging of the SAS, contrast injection from distal access catheters in the extracranial space is required, and absence of vasospasm from injection point to distal HF-OCT catheter tip is mandatory for adequate clearance and visualization. Furthermore, the limited field of view of the system with an imaging diameter of 14 mm restricts the complete visualization of the territory, allowing only structures in close proximity to the vessel to be sufficiently imaged. Perhaps the main limitation of the HF-OCT technology in clinical translation is that it requires selective microcatheterization and is obviously more invasive than techniques like MRI. However, even high-resolution imaging sequences on 3T MRI have isotropic voxel sizes of approximately 400 µm, which is not sufficient to image the vast majority of SATs.
Conclusion
Transvascular HF-OCT imaging of the SAS at high resolution has been demonstrated in this study. Feasibility for measuring the porosity and the thickness of the subarachnoid trabeculae was illustrated, as well as the ability to segment and reconstruct HF-OCT volumetric scans in three dimensions to identify characteristic morphologies. In vivo imaging of the SAS may inform function of the trabeculae and membranes, as well as provide new insights into various neurological diseases.
Supplemental material
Data availability statement
Data are available upon reasonable request. Data are available by contacting the corresponding author.
Ethics statements
Patient consent for publication
Ethics approval
This study does not involve human participants.
References
Supplementary materials
Supplementary Data
This web only file has been produced by the BMJ Publishing Group from an electronic file supplied by the author(s) and has not been edited for content.
Footnotes
Contributors VA, ASP, MJG: Responsible for planning, conception and design of the experiments, acquisition of data, analysis, interpretation of data, and reporting. ME: provided image analysis, interpretation of data, and reporting. RMK: assisted with acquisition of data, image analysis, and critical edits of the manuscript. GJU, AV: provided invaluable input in data interpretation, conception and design of the experiments, and critical editing of the manuscript. VA and MJG approved final version of manuscript and are guarantors of its content.
Funding This research was funded by the Massachusetts Life Sciences Center, Bits-to-bytes grant (PIs: Gounis, Ughi). The content is solely the responsibility of the authors and does not reflect the opinions of the sponsor.
Competing interests VA, ME, RMK, and AV declare no competing interest. GJU is an employee of Gentuity LLC. ASP: consultant for Medtronic Neurovascular and Stryker Neurovascular; research grants from Medtronic Neurovascular and Stryker Neurovascular. MJG has been a consultant on a fee-per-hour basis for Alembic LLC, Astrocyte Pharmaceuticals, BendIt Technologies, Cerenovus, Imperative Care, Jacob's Institute, Medtronic Neurovascular, Mivi Neurosciences, phenox GMbH, Q’Apel, Route 92 Medical, Stryker Neurovascular, Wallaby Medical; holds stock in Imperative Care, InNeuroCo, Galaxy Therapeutics and Neurogami; and has received research support from the Research support from the National Institutes of Health (NIH), the United States – Israel Binational Science Foundation, Anaconda, ApicBio, Arsenal Medical, Axovant, Balt, Cerenovus, Ceretrieve, CereVasc LLC, Cook Medical, Galaxy Therapeutics, Gentuity, Gilbert Foundation, Imperative Care, InNeuroCo, Insera, Jacob’s Institute, Magneto, Microvention, Medtronic Neurovascular, MIVI Neurosciences, Naglreiter MDDO, Neurogami, Philips Healthcare, Progressive Medical, Pulse Medical, Rapid Medical, Route 92 Medical, Stryker Neurovascular, Syntheon, ThrombX Medical, Wallaby Medical, the Wyss Institute and Xtract Medical. MJG is Associate Editor of Basic Science on the JNIS Editorial Board.
Provenance and peer review Not commissioned; externally peer reviewed.
Supplemental material This content has been supplied by the author(s). It has not been vetted by BMJ Publishing Group Limited (BMJ) and may not have been peer-reviewed. Any opinions or recommendations discussed are solely those of the author(s) and are not endorsed by BMJ. BMJ disclaims all liability and responsibility arising from any reliance placed on the content. Where the content includes any translated material, BMJ does not warrant the accuracy and reliability of the translations (including but not limited to local regulations, clinical guidelines, terminology, drug names and drug dosages), and is not responsible for any error and/or omissions arising from translation and adaptation or otherwise.