Article Text

Abstract
Background M2 occlusions may result in poor outcomes and potentially benefit from endovascular therapy. Data on the rate of M2 strokes is lacking.
Methodology Patients with acute ischemic stroke discharged over a period of 3 years from a tertiary level hospital in the ‘stroke belt’ were evaluated for M2 occlusions on baseline vascular imaging. Regional and national incidence was calculated from discharge and multicounty data.
Results There were 2739 ICD-9 based AIS discharges. M2 occlusions in 116 (4%, 95% CI 3.5% to 5%) patients constituted the second most common occlusion site. The median National Institute of Health Stroke Scale (NIHSS) score was 12 (IQR 5–18). Good outcomes were observed in 43% (95% CI 34% to 53%), poor outcomes in 57% (95% CI 47% to 66%), and death occurred in 27% (95% CI 19% to 37%) of patients. Receiver operating characteristics curves showed the NIHSS to be predictive of outcomes (area under the curve 0.829, 95% CI 0.745 to 0.913, p<0.0001). An NIHSS score ≥9 was the optimal cut-off point for predicting poor outcomes (sensitivity 85.7%, specificity 67.4%). 71 (61%) patients had an NIHSS score ≥9 and 45 (39%) an NIHSS score <9. The rate of good-outcome was 22.6% for NIHSS score ≥9 versus 78.4% for NIHSSscore <9 (OR=0.08, 95% CI 0.03 to 0.21, p<0.0001). Mortality was 42% for NIHSS score ≥9 versus 2.7% for NIHSS score <9 (OR=26, 95% CI 3.3 to 202, p<0.0001). Infarct volume was 57 (±55.7) cm3 for NIHSS score ≥9 versus 30 (±34)cm3 for NIHSS score <9 (p=0.003). IV recombinant tissue plasminogen activator (rtPA) administered in 28 (24%) patients did not affect outcomes. The rate of M2 occlusions was 7 (95% CI 5 to 9)/100 000 people/year (3%, 95% CI 2% to 4%), giving an incidence of 21 176 (95% CI 15 282 to 29 247)/year. Combined with M1, internal carotid artery terminus and basilar artery, this yields a ‘large vessel occlusion (LVO)+M2’ rate of 31 (95% CI 26 to 35)/100 000 people/year and a national incidence of 99 227 (95% CI 84 004 to 112 005) LVO+M2 strokes/year.
Conclusion M2 occlusions can present with serious neurological deficits and cause significant morbidity and mortality. Patients with M2 occlusions and higher baseline deficits (NIHSS score ≥9) may benefit from endovascular therapy, thus potentially expanding the category of acute ischemic strokes amenable to intervention.
- stroke
- thrombectomy
- incidence
- M2
This is an Open Access article distributed in accordance with the Creative Commons Attribution Non Commercial (CC BY-NC 4.0) license, which permits others to distribute, remix, adapt, build upon this work non-commercially, and license their derivative works on different terms, provided the original work is properly cited and the use is non-commercial. See: http://creativecommons.org/licenses/by-nc/4.0/
Statistics from Altmetric.com
Introduction
An estimation of acute ischemic strokes that could benefit from endovascular therapy is important for planning systems of care. Approximations derived from the total stroke incidence of ~795 000 in the USA (which in turn is a compilation of multiple studies)1 are susceptible to errors since each step in the derivation induces a layer of assumptions and uncertainty. Therefore, a top-down analysis may lead to wide variations in the number of large vessel strokes that could be treated with mechanical thrombectomy. An assessment from the ground up based on imaging confirmation would be relatively more accurate in determining the rate of large vessel occlusions (LVOs). Recent population-based studies using the latter approach estimated an annual incidence of 22–24 large vessel strokes per 100 000 people.2 3 Large vessel strokes were defined as occlusion of the middle cerebral artery main stem, the internal carotid artery terminus (ICA-T) and the basilar artery (BA), confirmed on initial vascular imaging.2 The recent clinical trials demonstrating superior efficacy of endovascular therapy over intravenous thrombolysis were restricted to patients with an ICA-T or middle cerebral artery M1 occlusion.4–7 However, other studies have evaluated the possible beneficial role of endovascular therapy in patients with M2 occlusions.8–10 The typical classification of the middle cerebral artery and its early branches is based on microsurgical anatomy and is subject to variations.11–13 The goal of our study was to estimate the incidence of M2 occlusions, confirmed by imaging, presenting as acute ischemic strokes based on hospital discharge and regional county data reported to the state’s Department of Health and Human Resources (DHHR).
Methodology
This is an institutional review board approved population based study of patients with acute ischemic stroke designed to determine the incidence of M2 occlusions.
Patient selection
All patients discharged with a primary or secondary diagnosis of acute ischemic stroke (AIS) based on ICD-9 diagnosis codes 433.xx (Occlusion and stenosis of precerebral arteries), 434.xx (Occlusion of cerebral arteries), and 435.xx (Transient cerebral ischemia) from an academic tertiary level hospital in a rural setting, capturing 85% of all cases of AIS from its primary service area (PSA) over a 3-year period (March 2012 to March 2015), were evaluated for the presence of M2 occlusions based on baseline vascular imaging studies.
The 3-year study period covers a time when the center was participating in a randomized controlled trial6 comparing endovascular therapy after IV recombinant tissue plasminogen activator (rtPA) with IV rtPA alone and was thus offering treatment only in the setting of the clinical trial. Thus M2 occlusions were excluded from endovascular therapy. However, eligible patients did receive intravenous thrombolysis with rtPA.
Imaging parameters
The majority (91%) of patients were screened with CT imaging. A ‘stroke protocol’ CT scan that includes a non-contrast CT scan, CT angiography (CTA), and CT perfusion is typically performed on a 320-slice multidetector CT scanner (Toshiba Aquilion ONE ViSION, Toshiba Medical, Tustin, California, USA) capable of whole brain volumetric perfusion CT (V-PCT) sequences and CTA. Following non-contrast CT, single-phase spiral CTA is performed from the aortic arch to the cranial vertex (120 kV, 120 mA, rotation time 0.3 s, pitch 0.6, collimation 2×64 × 0.6 mm) with 50–70 mL of contrast medium injected at 4 mL/s through a large antecubital vein, followed by a 30 mL saline chaser at 3 mL/s. The V-PCT sequence consists of 19 consecutive volumetric acquisitions of the brain (160 mm in the z-axis, 7 s delay after the start of contrast medium injection, 55 s total imaging duration, 80 kV, 150–300 mA, rotation time 0.3 s). A 50 mL bolus of contrast medium—that is, Isovue-370 (Bracco, Milan, Italy) is used at a flow rate of 4 mL/s. Immediate post-processing is performed on a Vitrea perfusion package (Vital Images Inc, Minnetonka, Minnesota, USA) with a singular value deconvolution algorithm. The consecutive volumetric acquisitions are also used to create time-resolved angiographic images.
The MRI stroke protocol is performed on a 3 T unit and consists of diffusion-weighted acquisition (resulting in b=0, b=1000, and apparent diffusion coefficient maps), gradient-echo blood sensitive sequence, intracranial magnetic resonance angiography, and arterial spin labeling perfusion imaging. Optional sequences, which are applied in certain circumstances, include extracranial magnetic resonance angiography (three-dimensional time-of-flight) and T2-weighted fluid attenuated inversion recovery imaging.
All patients, regardless of the stroke severity, received the baseline imaging study. The time from symptom onset to presentation and the time from hospital arrival to imaging were recorded and analyzed.
Imaging analysis
A total of 2798 patients with a primary or secondary diagnosis of AIS were discharged from hospital over the 3-year period. A baseline vascular imaging study was available in 2739 (98%) patients, who formed the primary cohort for this analysis. The occlusion site was determined on the admission CT angiogram in 2490 (91%) and an MR angiogram in 249 (9%) patients. In patients with a proximal M2 occlusion, designation of the occluded branch (eg, superior or inferior division) was determined by consensus between two experienced neuroradiologists, based on previously published anatomical studies describing the middle cerebral artery and its branches.11 13 14 Volumetric data from a follow-up MRI or CT study performed within a week were used to calculate the infarct volume, which served as a marker for final ischemic injury. Examples of acutely occluded superior and inferior divisions are given in figure 1 and 2, respectively.

Acute occlusion of a left superior division. The first column shows axial and sagittal multiple intensity projection images localizing the occluded superior division (white arrows). The second column shows abnormal time-to-peak perfusion maps (axial, coronal, sagittal) highlighting the ischemic territory corresponding to the occluded superior division. The third column shows non-contrast CT (axial, coronal, sagittal) images obtained after 24 hours showing a large acute infarct involving the superior division and corresponding to the time-to-peak maps.

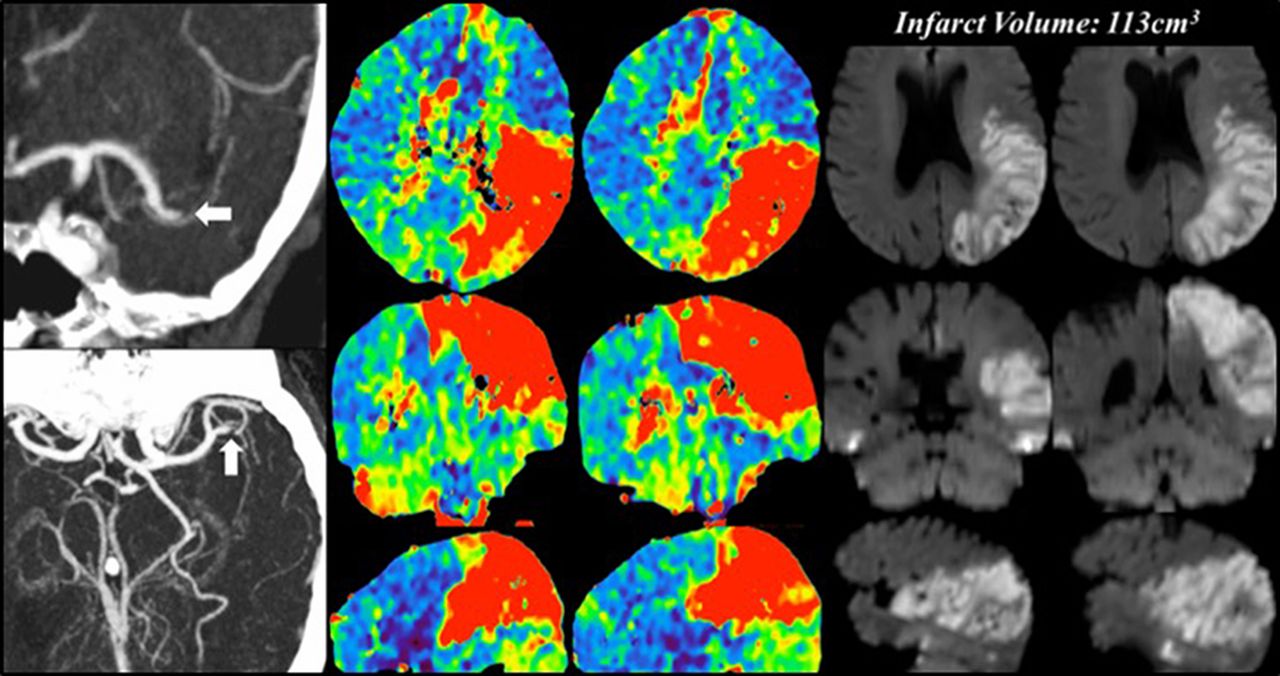
Acute occlusion of a left inferior division. The first column shows axial and coronal multiple intensity projection images localizing the occluded inferior division (white arrows). The second column shows abnormal time-to-peak perfusion maps (axial, coronal, sagittal) highlighting the ischemic territory corresponding to the occluded inferior division. The third column shows volumetric diffusion-weighted images (axial, coronal, sagittal) from an MRI examination performed after 48 hours showing a large acute infarct involving the inferior division and corresponding to the time-to-peak maps.
Estimating the incidence of M2 occlusions
The incidence of M2 occlusions was calculated for the hospital’s four-county PSA with a 2013 population of 210 000. The total hospital discharges from each county are reported to the state’s DHHR. The hospital captured 85% of these from its PSA in 2013, and county data accounted for the remaining 15%. From these data an annual rate of M2 occlusions per 100 000 people was determined. Using the 2016 US population (as of December 31, 2016) of ~324 000 000 (https://www.census.gov/popclock/), we used our results to generate rates and ranges of annual M2 incidence nationally. This was based on similar methodology using regional data to derive national incidence15 and estimating total stroke numbers (~795 000).1 2 15 The rates of M2 occlusions from our study were combined with the previously published rate of large vessel strokes from the same data2 to estimate an incidence of LVOs that included ICA-T, M1, BA, and M2 arteries.
The rate of the total number of AIS derived from these data was compared with the 87% rate of AIS among all strokes (795 000)1 to serve as an internal reference and marker for assessing the accuracy of results in the face of racial/ethnic differences between the population under study and the national population. The presenting National Institute of Health Stroke Scale (NIHSS) score was recorded as a function of stroke severity and was correlated with the 90-day clinical outcome based on the modified Rankin Scale (mRS) score, with an mRS score of 0–2 representing a good outcome.
Statistical analysis
The patient demographics and stratification based on time and imaging are described and compared. All data analysis was performed using JMP statistical software, V.11 (SAS Institute Inc., Cary, North Carolina, USA). The significance of simple bivariate associations was assessed using Fisher’s exact test for categorical variables, Student’s t test for continuous variables, or logistic regression, as appropriate. We also generated receiver operating characteristics (ROC) curves and calculated the area under the curve (AUC) and 95% confidence intervals, with NIHSS score as the test variable and poor outcome as the response. An optimal cut-off point of the NIHSS score with associated sensitivity, specificity, and positive and negative predictive values was determined for predicting poor outcome. We then dichotomized the NIHSS score based on the optimal cut-off point and compared clinical outcomes, mortality and infarct volumes for a score above and below the cut-off value.
Results
A total of 2739 patients had a discharge diagnosis of AIS based on the ICD codes described above. The mean age for the entire cohort was 67 (±16) years and 1418 (52%) of these were female. The overwhelming majority of patients—that is, 2118 (77%, 95% CI 76% to 79%) did not have an identifiable vascular occlusion on initial imaging. There were 324 (12%, 95% CI 11% to 13%) patients with a LVO (M1, ICA-T, or BA) and 297 (11%, 95% CI 10% to 12%) patients with a small vessel occlusion. The distribution of occlusion sites (figure 3) shows that proximal M2 occlusions observed in 116 (4.2%, 95% CI 3.5% to 5%) patients constituted the second most common location (after M1) among all AIS discharges. The inferior division was occluded in 62 (53%, 95% CI 44% to 62%) patients and the superior division in 54 (47%, 95% CI 38% to 56%) patients.

The chart shows distribution of all vascular occlusion sites (n=619). The rate given above each bar is n (%, 95 CI) based on the entire sample (n=2739).
The baseline characteristics for patients with an M2 occlusion are given in table 1.
Baseline characteristics of patients presenting with an M2 occlusion
Clinical outcome data were available for 99 (85%) patients. A good outcome (mRS score 0–2) was seen in 43 (43%, 95% CI 34% to 53%) and a poor outcome in 56 (57%, 95% CI 47% to 66%) patients. The median NIHSS score was 15 (IQR 11–21) in patients with a poor outcome versus 5 (IQR 3–12) in those with a good outcome (p<0.0001). The AUC of the ROC curve for predicting a poor outcome was 0.829 (95% CI 0.745 to 0.913, p<0.0001). The optimal cut-off point for the NIHSS in predicting a poor outcome was an NIHSS score of 9 with a sensitivity of 85.7% (95% CI 76.5% to 94.9%), specificity of 67.4% (95% CI 53.4% to 81.4%), positive predictive value of 77.4% (95% CI 67% to 87.8%), and negative predictive value of 78.4% (95% CI 65.1% to 91.6%). The NIHSS was then dichotomized based on this cut-off value of 9. There were 71 (61%) patients with an NIHSS score ≥9 and 45 (39%) with an NIHSS score <9. Among patients with an NIHSS score ≥9, a good outcome was seen in only 14/62 (22.6%) patients versus a good outcome in 29/37 (78.4%) patients with an NIHSS score <9 (OR=0.08, 95 CI 0.03 to 0.21, p<0.0001). Presenting NIHSS score correlated with the final infarct volume; for patients with an NIHSS score ≥9 the infarct volume was 57 (±55.7) cm3 versus 30 (±34) cm3 for patients with NIHSS score <9 (p=0.003). Infarct volume also correlated with clinical outcomes; in patients with a good outcome the infarct volume was 21 (±25) cm3 versus an infarct volume of 59 (±48) cm3 in patients with poor outcome (p<0.0001). Overall mortality was observed in 27/99 (27.2%) patients. Among patients presenting with an NIHSS score ≥9, death occurred in 26/62 (42%) and for patients with NIHSS score <9, death occurred in only 1/37 (2.7%) patient (OR=26, 95% CI 3.3 to 202, p<0.0001). Intravenous rtPA was administered in 28 (24%) patients with an M2 occlusion. Of the 30 patients who were transferred from another hospital (table 1) only two received IV rtPA before transfer. One of them with an initial NIHSS score of 3 had a good outcome, the second patient with an initial NIHSS score of 22 had a poor outcome. There was no difference in outcomes based on IV rtPA administration; however, it is important to note that the study was neither designed nor powered to assess the treatment effect of IV rtPA.
Estimating the annual incidence of M2 occlusions
There were 1157 patients from the hospital’s PSA with an ICD-9 discharge diagnosis of AIS. M2 occlusions observed in 35 patients in this cohort accounted for 3% (95% CI 2% to 4%) of all admissions. Based on the discharge data reported by each county in the PSA to the DHHR, the hospital accounted for 85% of all stroke discharges in the four-county PSA. The remaining 15% were obtained from county data, which yielded 1361 AIS discharges over the 3-year study period. The national incidence of all AIS was estimated at 700 034 ischemic strokes per year, which is slightly higher than the 691 650 derived from the 87% AIS rate among all strokes.1 Based on the incidence of imaging-confirmed M2 occlusions in this population we estimated the annual incidence per 100 000 people within our PSA and used the 2016 US population data to estimate a national incidence (table 2).
First row: the cumulative 3-year rate of acute ischemic strokes (AIS) and all M2 occlusions (3%, 95% CI 2 to 4) in the hospital’s four-county primary service area (PSA) with a population of 210 000. Second row: the annual incidence of AIS and M2 occlusions per 100 000 people in the PSA. Third row: the results extended to the US population for 2016 to generate an annual national incidence of M2 occlusions per 100 000 people
Based on the previously published estimated incidence of 24 (95% CI 20 to 28) large vessel strokes per 100 000 person-years2 from the same dataset, addition of all proximal M2 occlusions to the M1, ICA-T and BA occlusions resulted in 164 (14%, 95% CI 12% to 16%) ‘LVO +M2’ strokes among all AIS discharges from the hospital’s PSA. The rate and incidence of LVO plus all M2 occlusions were derived at the regional and national level using the 2016 US population (table 3).
First row: the cumulative 3-year rate of acute ischemic strokes (AIS) and large vessel occlusions (LVOs) plus all M2 occlusions in the hospital’s four-county primary service area (PSA) with a population of 210 000. Second row: the annual incidence of AIS and ‘LVO plus M2’ occlusions per 100 000 people in the PSA. Third row: the results extended to the US population for 2016 to generate an annual national incidence of ‘LVO plus M2’ occlusions
Discussion
This study estimates a national incidence of 700 034 acute ischemic strokes annually (based on the 2016 US population), which is similar to, although slightly higher than, the 691 650 estimate derived from the ~795 000 total strokes using the 87% ischemic stroke rate.1 The similarity of the incidences provides an internal check for assessing the validity of these estimates. The slightly higher estimate in this analysis might be due to the higher than national average of stroke and cardiovascular disease in the population under study despite the potential differences in racial makeup.1 The strength of the study lies in the baseline vascular imaging assessment of the occlusion site among all ICD-9 defined AIS discharges from a geographic population served by one large hospital system. This ground-up methodology based on confirmation of occlusion site may be more reliable than a top-down approach starting from the total stroke numbers. The rationale for using ICD-9 discharge data and not emergency room admission numbers for suspected stroke is to allow for homogeneity in analysis and also to provide a consistent variable that can be used by other centers or studies for comparative analyses. The rate of M2 occlusions was 7 (95% CI 5 to 9)/100 000 people/year or 3% (95% CI 2% to 4%) of all AIS discharges, yielding an annual incidence of 21 176 (15 282–29 247) M2 strokes nationally. As such M2 branches followed the main stem M1 as the most common occlusion site. This may be because an M2 branch is a downstream continuum of the middle cerebral artery where, possibly, owing to flow dynamics, most of the embolic clots end up.
The median NIHSS score of 12 (IQR 5–18) indicates that M2 occlusions can present with significant neurological deficits. The ROC analysis for NIHSS in predicting outcomes yielded an NIHSS score of 9 as the optimal cut-off point for predicting a poor outcome. A dichotomized NIHSS in this analysis showed that patients with an M2 occlusion and an NIHSS score of ≥9 had significantly worse outcomes than those with an NIHSS score of <9. This NIHSS cut-off point is higher than the current guidelines that recommend endovascular treatment for patients with a LVO presenting with an NIHSS score of ≥6.16 It is possible that a higher level of function disability at presentation may be required for the more distal M2 occlusions (relative to M1 or ICA-T) to show superior efficacy of endovascular therapy versus medical management or thrombolytic therapy.
Administration of IV rtPA in this study did not affect outcomes but, as noted, the analysis was not designed or powered to detect this difference. A good outcome rate of 43% for untreated M2 occlusions in this study is similar to the 40% reported previously with a similar severity of NIHSS at presentation17 and slightly lower than the 54% good outcome rate in another study but with lower median presenting NIHSS.18 A good outcome rate of 48% has been reported in patients treated with IV rtPA.19 Endovascular treatment of M2 occlusions has been shown to be technically feasible and safe.8 9 One previous study has also shown it to be better than IV thrombolysis alone—76% good outcomes for endovascular therapy versus 47.8% for IV thrombolysis (p=0.01, OR=3.5, 95% CI 1.2 to 10.2).5
Randomized, prospective data are scarce but the large number of poor outcomes and the potentially large ischemic injury resulting from M2 occlusions in this study, the greater the likelihood of poor outcomes in un-recanalized M2 occlusions in previous studies,9 20 and the potential superior efficacy of endovascular therapy for M2 occlusions in comparison with IV thrombolysis10 make these the logical next targets for mechanical thrombectomy.
The addition of M2 occlusions to the current established large vessel category (M1, ICA-T, BA) can expand the population of potentially treatable ‘large vessel’ strokes. An LVO+M2 rate of 31 (95% CI 26 to 35)/100 000 people/year translates into a national incidence of 99 227 (95% CI 84 004 to 112 005) LVO+M2 strokes. In contrast the rate of ST-segment elevation myocardial infarction is reported to be between 73 and 77 new cases/1 00 000 people/year,21 22 or over twice the rate of LVO plus M2 occlusions. This is perhaps an important comparison to keep in mind as endovascular stroke therapy matures and systems of care evolve.
Limitations
The population under study is relatively racially homogeneous and thus does not account for the somewhat higher rate of strokes in African-American or Hispanic populations. The population is, however, in the geographic ‘stroke belt’ with higher than national average of cardiovascular disease and stroke, as also indicated by the slightly larger estimate of the incidence of all acute ischemic strokes compared with that previously reported. Nonetheless, this is a limitation that can affect final estimates, which might not be covered by the range provided in the 95% confidence intervals. We used previously described and established methodology for deriving national rates from regional data but there is potential room for error in this methodology. We attempted to limit the effect of these limitations by meticulously examining ICD-9 AIS discharges from a multicounty region and using baseline imaging to assess occlusion sites.
Conclusions
M2 occlusions can present with serious neurological deficits, resulting in large infarcts and significant morbidity and mortality. M2 occlusions accounted for 3% (95% CI 2% to 4%) of all AIS discharges with a rate of 7 (95% CI 5 to 9)/100 000 people/year (3%, 95% CI 2% to 4%), giving an incidence of 21 176 (95% CI 15 282 to 29 247) M2 strokes per year. An NIHSS cut-off point of ≥9 can potentially be used to screen these patients for endovascular therapy. Combining M2 occlusions with ICA-T, M1 and BA gives a rate of 31 (95% CI 26 to 35) LVO+M2 occlusions/100 000 people/year and a national incidence of 99 227 (95% CI 84 004 to 112 005) LVO+M2 occlusions per year, which would be a 22% increase over the previous estimate of LVO strokes alone.
References
Footnotes
Contributors ATR: study design, data analysis, manuscript preparation. JRD, CB, ART, DF, SB: data collection. JSC: manuscript preparation.
Competing interests None declared.
Ethics approval Institutional Review Board.
Provenance and peer review Not commissioned; externally peer reviewed.
Data sharing statement There are no additional supplemental data.