Article Text

Abstract
Background We studied the effects of endovascular treatment (EVT) and the impact of the extent of recanalization on cerebral perfusion and oxygenation parameters in patients with acute ischemic stroke (AIS) and large vessel occlusion (LVO).
Methods Forty-seven patients with anterior LVO underwent computed tomography perfusion (CTP) before and immediately after EVT. The entire ischemic region (Tmax >6 s) was segmented before intervention, and tissue perfusion (time-to-maximum (Tmax), time-to-peak (TTP), mean transit time (MTT), cerebral blood volume (CBV), cerebral blood flow (CBF)) and oxygenation (coefficient of variation (COV), capillary transit time heterogeneity (CTH), metabolic rate of oxygen (CMRO2), oxygen extraction fraction (OEF)) parameters were quantified from the segmented area at baseline and the corresponding area immediately after intervention, as well as within the ischemic core and penumbra. The impact of the extent of recanalization (modified Treatment in Cerebral Infarction (mTICI)) on CTP parameters was assessed with the Wilcoxon test and Pearson’s correlation coefficients.
Results The Tmax, MTT, OEF and CTH values immediately after EVT were lower in patients with complete (as compared with incomplete) recanalization, whereas CBF and COV values were higher (P<0.05) and no differences were found in other parameters. The ischemic penumbra immediately after EVT was lower in patients with complete recanalization as compared with those with incomplete recanalization (P=0.002), whereas no difference was found for the ischemic core (P=0.12). Specifically, higher mTICI scores were associated with a greater reduction of ischemic penumbra volumes (R²=−0.48 (95% CI –0.67 to –0.22), P=0.001) but not of ischemic core volumes (P=0.098).
Conclusions Our study demonstrates that the ischemic penumbra is the key target of successful EVT in patients with AIS and largely determines its efficacy on a tissue level. Furthermore, we confirm the validity of the mTICI score as a surrogate parameter of interventional success on a tissue perfusion level.
- angiography
- CT perfusion
- stroke
- thrombectomy
- intervention
Data availability statement
Data are available upon reasonable request by contacting the corresponding author.
This is an open access article distributed in accordance with the Creative Commons Attribution Non Commercial (CC BY-NC 4.0) license, which permits others to distribute, remix, adapt, build upon this work non-commercially, and license their derivative works on different terms, provided the original work is properly cited, appropriate credit is given, any changes made indicated, and the use is non-commercial. See: http://creativecommons.org/licenses/by-nc/4.0/.
Statistics from Altmetric.com
Introduction
Endovascular treatment (EVT) of acute ischemic stroke (AIS) is the current therapeutic standard for patients with large vessel occlusion (LVO) in conjunction with intravenous thrombolysis.1 In this context, careful patient selection is essential to minimize complications and optimize costs associated with the procedure, and past clinical trials have set their inclusion criteria either with a combination of clinical and computed tomography (CT)-based measures (Alberta Stroke Program Early CT score (ASPECTS)) alongside CT angiography to identify the site of vessel occlusion, or through the evaluation of the tissue at risk, namely in the form of the perfusion mismatch between the salvageable ischemic penumbra and the critically hypoperfused ischemic core.2 The efficacy of EVT was highlighted in a recent meta-analysis, which demonstrated a positive treatment effect across several different patient stratification (eg, age, sex, stroke severity, localization, etc.).3 Here, the results of EVT have been shown to be highly time-dependent, and the highest level of evidence in favor of EVT was found in patients’ pre-stoke modified Rankin Scale (mRS) of 0–1, an National Institutes of Health Stroke Scale (NIHSS) score higher than 6, and a time window below 6 hours of onset,1 with recent studies identifying the final infarct volume, the NIHSS score at 24 hours and the pre-morbid mRS score as the most important predictors of outcome at 90 days following EVT.4
The ischemic penumbra has been the longstanding therapeutic target of ischemic stroke treatment, and can be assessed clinically with multiple imaging methods, including 15O-positron emission tomography (PET),5 magnetic resonance imaging (MRI) with diffusion/perfusion mismatch,6 as well as CT perfusion (CTP).7 MRI- or CTP-based perfusion mismatch were applied as main inclusion criteria for patient selection within several randomized controlled trials that evaluated the safety and efficacy of EVT (eg, EXTEND-IA,8 SWIFT PRIME9). Here, the stringent inclusion of patients with large perfusion mismatch ratios lead to the highest rates of favorable outcome reported so far with EVT (71% in EXTEND-IA8 and 60% in SWIFT PRIME9). Moreover, more recent trials also demonstrated a clinical benefit for patients with a large perfusion mismatch who were treated in an extended time window 6–24 hours after stroke onset (eg, DEFUSE-3, DAWN).10 11 In this context, several retrospective analyses highlighted the importance of collateral flow in determining the tissue viability over time as well as the individual differences in growth rate of the infarct core.12–14
CTP, while presenting drawbacks in accuracy and spatial resolution as compared with PET or MRI,15 offers various advantages in terms of costs, availability, execution speed and logistic simplicity, and its validity has been successfully proven in the retrospective analysis of multiple clinical trials.16 17 These studies demonstrated how the ischemic core on baseline CTP prior to EVT correlates well with the final infarct at follow-up in patients who obtained a complete recanalization as calculated by the modified Treatment in Cerebral Infarction (mTICI) score,18 indirectly suggesting that the penumbra is the key target of successful EVT.16 17 In a very recently published article, Rubiera et al performed a repeated CTP within 30 minutes of completion of EVT, demonstrating also its value as a surrogate marker of therapeutic success.19 Moreover, oxygenation metrics similar to what can be obtained by PET imaging can be extracted from the CTP information through mathematical modeling, and have been proposed as promising new markers to assess the tissue status in AIS.14 20 21
Here we report on the effects of EVT and the impact of the extent of recanalization on cerebral perfusion parameters in patients with AIS and LVO by performing CTP before and immediately after mechanical recanalization, with the aim of studying the perfusion correlates of the interventional mTICI score.
Methods
Retrospective interpretation of prospectively acquired data was approved by the local ethics committee (No. S-303/2014 and S-784/2018) of the University of Heidelberg. A consecutive series of 62 patients with diagnosis of AIS and LVO underwent CTP immediately before and after EVT at the Department of Neuroradiology of the Heidelberg University Hospital (Heidelberg, Germany) during the period January 2015 to January 2017. Thereby, both CT imaging and EVT were performed without further patient transfer within the CT imaging suit using a combined CT/C-arm setting, as described previously, and outlined in the online supplemental methods.22 23 Multimodal CT imaging included non-contrast head CT (NCCT), single-phase CT angiography and CTP before and immediately after conclusion of the interventional procedure (online supplemental methods 1). Furthermore, all patients underwent a repeated NCCT at follow-up within 18–36 hours after the intervention. According to guidelines,1 patients presenting within 4.5 hours from symptom onset with no significant infarction or hemorrhage on NCCT were eligible to receive intravenous recombinant tissue plasminogen activator (rtPA). Patients underwent EVT by means of either aspiration catheters or retrievable stents (Solitaire, Medtronic; Trevo, Stryker; ERIC, MicroVention; Catch, Balt Germany) or a combination of both.
Supplemental material
Image post-processing
Raw perfusion data were analyzed using the Cercare Medical Neurosuite (Cercare Medical, Aarhus, Denmark), including singular value decomposition (SVD)-based24 as well as parametric deconvolution post-processing25 with automatic detection of arterial input function (AIF).26 SVD-derived maps of cerebral blood volume (CBV), cerebral blood flow (CBF), mean transit time (MTT) and time-to-maximum (Tmax) were used for further analyses, alongside time-to-peak (TTP), capillary transit time heterogeneity (CTH), coefficient of variation (COV), oxygen extraction fraction (OEF) and metabolic rate of oxygen (CMRO2) obtained through parametric deconvolution.21 Motion correction and identification of the AIF was visually reviewed, and cases with inconsistent signal in CTP (ie, due to poor AIF) which could not be corrected with manual processing were excluded from further analysis.
Images were further processed and coregistered as described in the online supplemental methods, and patients with suboptimal image quality which could impair quantitative analysis (ie, motion artifacts, registration errors, significant anatomical alterations/mismatch after intervention, diffuse intracranial bleeding) were then excluded from subsequent analysis. The area of perfusion alteration was segmented at baseline on Tmax maps using ITK-SNAP (www.itksnap.org) and thresholded to only include voxels with Tmax >6 s, corresponding to the entire ischemic region (ischemic core + ischemic penumbra). Normalized median CTP values (nCBV, nCBF, nMTT, nTTP, nTmax, nCMRO2, nCTH, nOEF, nCOV) were obtained by dividing median extracted values by the median values extracted from an oval region of interest (ROI) placed on the contralateral healthy white matter, which was designed on a single slice in the centrum semiovale. The CTP parameters were quantified from the threshholded segmentation mask at baseline and from the identical area on post-interventional imaging, and the percentage-wise change between the two timepoints was also calculated for both CTP values and penumbra/core volumes. The final infarcted area was segmented on the follow-up NCCT performed 18–36 hours after EVT. The mTICI score after EVT was prospectively assessed by the senior neurointerventionalist in charge of the procedure, and patients were classified in ‘complete’ recanalization outcome when they presented a mTICI >2b, and in ‘incomplete’ recanalization when they presented a mTICI ≤2b. Clinical data were collected by a certified stroke neurologist at hospital admission.
Statistical analysis
Statistical analysis was performed in R version 3.6.2 (R Foundation for statistical computing, Vienna, Austria). The distribution of clinical, imaging and angiographic characteristics between patients with complete or incomplete recanalization was compared with the Chi-square test for categorical parameters and the Wilcoxon test for continuous parameters. Differences in CTP parameters between baseline and post-interventional imaging stratified by interventional outcome were compared with the Wilcoxon matched-pairs test. Correlations were tested using Pearson’s correlation coefficient, where coefficients between ±0.50 and ±1 were considered strong correlations, between ±0.30 and ±0.49 moderate correlations, and values below ±0.29 were regarded as poor correlations.
Results
After review of the imaging data and exclusion of cases with posterior circulation stroke (n=1) or suboptimal imaging quality (movement artefacts (n=4), registration errors (n=1) or poor arterial input function (n=9) in either one of the two CTP acquisitions), 47/62 patients (75.1%) were finally included for analysis, with 25 patients achieving complete recanalization outcome and 22 patients incomplete recanalization. Example cases of processed and segmented perfusion data for patients with complete versus incomplete recanalization outcome are depicted in figure 1. The baseline clinical, imaging and angiographic characteristics of the study population were equally distributed between the favorable and unfavorable outcome cohorts (online supplemental table 1) except for the time from groin puncture to final mTICI score, which was higher in patients with incomplete recanalization (88 min (IQR 59–104)) as compared with those with complete recanalization (49 min (IQR 38–72), P=0.005).
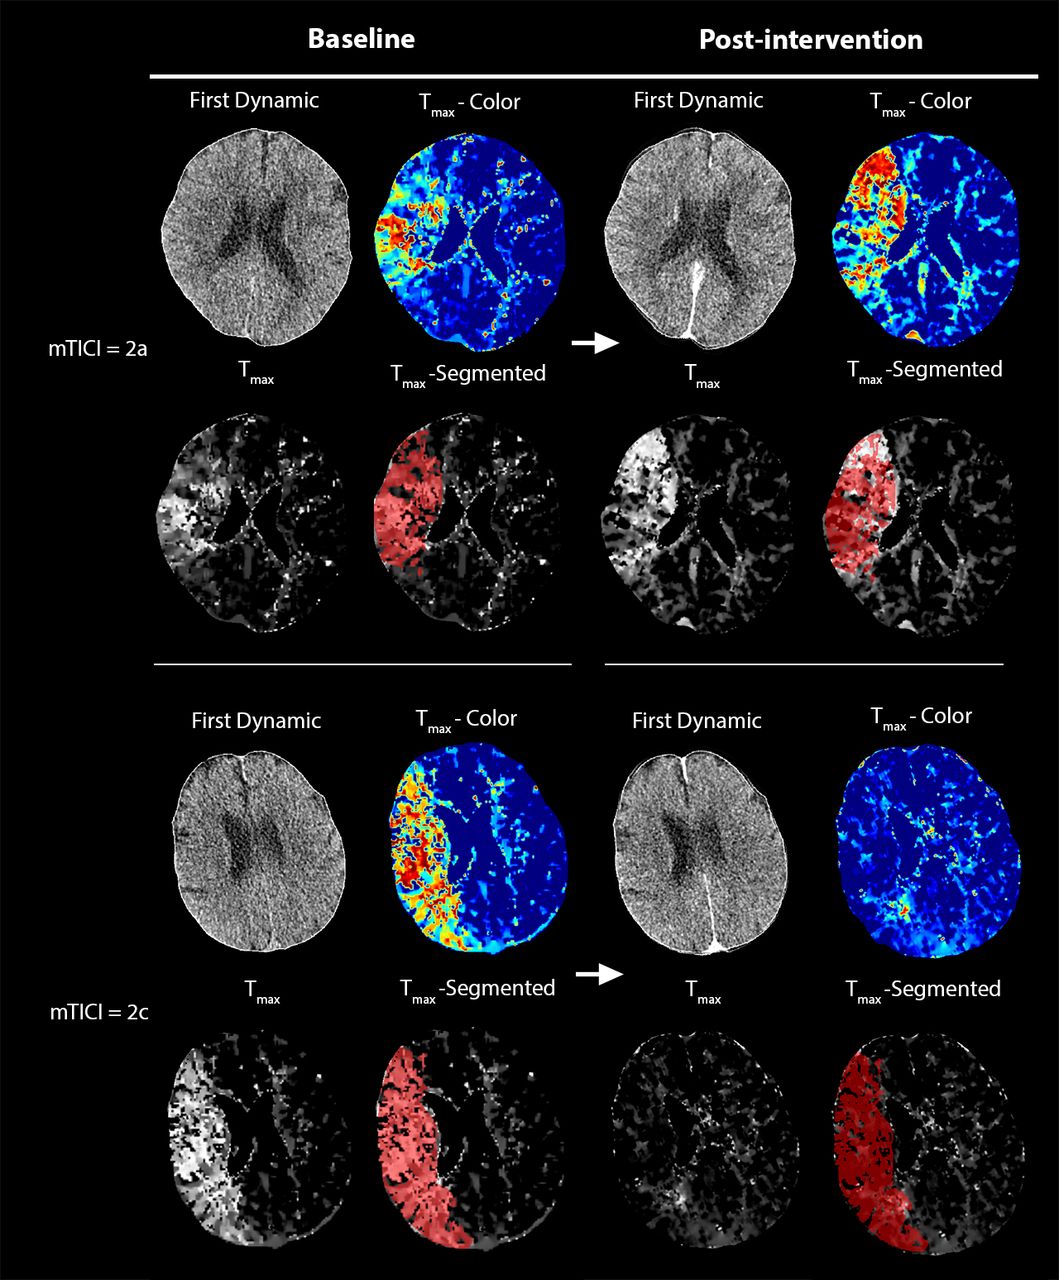
Example of processed computed tomography perfusion (CTP) data before and after mechanical thrombectomy. Time-to-maximum (Tmax) maps are shown both in color and grayscale, and the segmentation of the baseline alteration of perfusion (voxels Tmax >6 s) is also overlayed onto both the baseline and post-interventional grayscale Tmax images to improve referencing of the changes in the initially affected area. In the upper row, a patient with modified Treatment in Cerebral Infarction (mTICI) = 2a, demonstrating a largely unchanged perfusion alteration after intervention. In the lower row, a patient with mTICI = 2c, demonstrating a dramatic reduction of the perfusion alteration after interventional therapy, with only a small area of focally elevated Tmax adjacent to the left lateral ventricle, indicating a successful reperfusion of the vast majority of the initially affected tissue.
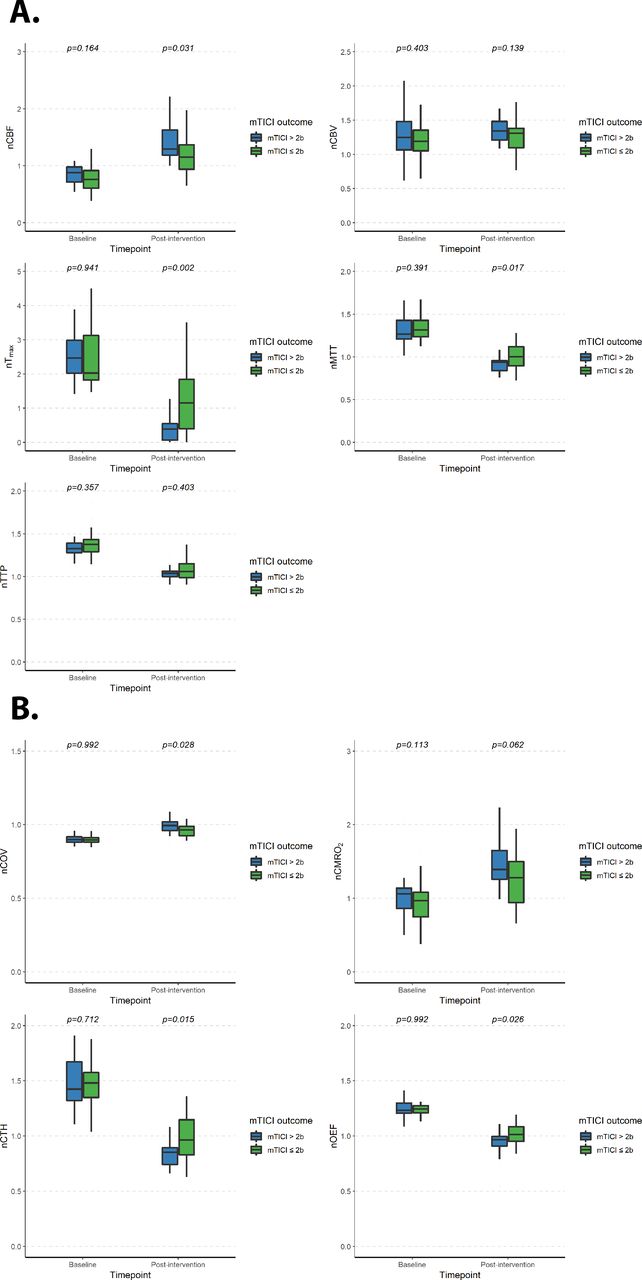
EVT resulted in an overall normalization of the altered brain perfusion and oxygenation metrics across the entire cohort when considering the entire hypoperfused area, with significant differences in the normalized metrics within the whole ischemic area (P<0.001) except for nCBV (online supplemental figures 1 and 2). After stratification of the patients according to the mTICI outcome (figure 2), patients with complete recanalization, as compared with those with incomplete recanalization, presented lower post-interventional median nTmax (0.385 (IQR 0.068–0.551) vs 1.160 (IQR 0.403–1.847), P=0.001), nMTT (0.938 (IQR 0.841–0.957) vs 1.002 (IQR 0.896–1.118), P=0.0174), nCTH (0.853 (IQR 0.742–0.895) vs 0.965 (IQR 0.831–1.146), P=0.014) and nOEF values (0.966 (IQR 0.910–0.995) vs 1.015 (IQR 0.952–1.084), P=0.026) values, with higher nCBF (1.318 (IQR 1.189–1.645) vs 1.154 (IQR 0.941–1.368), P=0.031) and nCOV (0.995 (IQR 0.960–1.019) vs 0.965 (IQR 0.927–0.988), P=0.028). This was coupled with a significantly higher percentage-wise reduction of the nTmax values (when comparing the change in nTmax from baseline to immediately after EVT) in patients with complete recanalization (median of −83% (IQR −77% to −97%)) as compared with those with incomplete recanalization (median of −59% (IQR −35% to −80%)) (P=0.001) (online supplemental figures 3 and 4).

Quantitative perfusion (A) and oxygenation (B) metrics before and after mechanical thrombectomy, stratified by modified Treatment in Cerebral Infarction (mTICI) outcome. nCBF, normalized cerebral blood flow; nCBV, normalized cerebral blood volume; nCMRO2, normalized metabolic rate of oxygen; nCOV, normalized coefficient of variation; nCTH, normalized capillary transit time heterogeneity; nMTT, normalized mean transit time; nOEF, normalized oxygen extraction fraction; nTmax, normalized time-to-maximum; nTTP, normalized time-to-peak.
Analysis of the dynamics in the ischemic core and ischemic penumbra volumes showed significantly lower volumes of ischemic penumbra immediately after EVT in patients with a complete recanalization (median of 13.5 cm3 (IQR 9.4–32.1)) as compared with those with incomplete recanalization (median of 32.1 cm3 (IQR 16.9–54.1)) (P=0.039) (figure 3A, middle). This was coupled with a greater percentage-wise reduction in the volume of the ischemic penumbra (comparing values at baseline with those immediately after EVT) in patients with a complete recanalization (median reduction of −80% (IQR -65% to −92%)) as compared with those with incomplete recanalization (median reduction of −49% (IQR −11% to 77%)) (P=0.005) (online supplemental figure 5). The percentage-wise change of volume for the ischemic penumbra showed a significant correlation with the mTICI score (Pearson correlation coefficient of −0.48 (95% CI −0.67 to –0.22), P=0.001) (figure 3B, middle). No significant difference was found for the volume of the ischemic core immediately after EVT (P=0.123, figure 3A, bottom), with no significant correlation for the percentage-wise change (comparing values at baseline with those immediately after EVT) between patients with complete versus incomplete recanalization (Pearson correlation coefficient of −0.24 (95% CI −0.50 to –0.05), P=0.098) (figure 3B, bottom).

(A) Total volumes before and after interventional treatment for the total affected area of hypoperfusion, the ischemic penumbra and the ischemic core, stratified by modified Treatment in Cerebral Infarction (mTICI) outcome. (B) Plotted correlations between the percentage-wise change in volume after endovascular treatment for total ischemic area, ischemic penumbra and ischemic core, stratified by mTICI outcome.
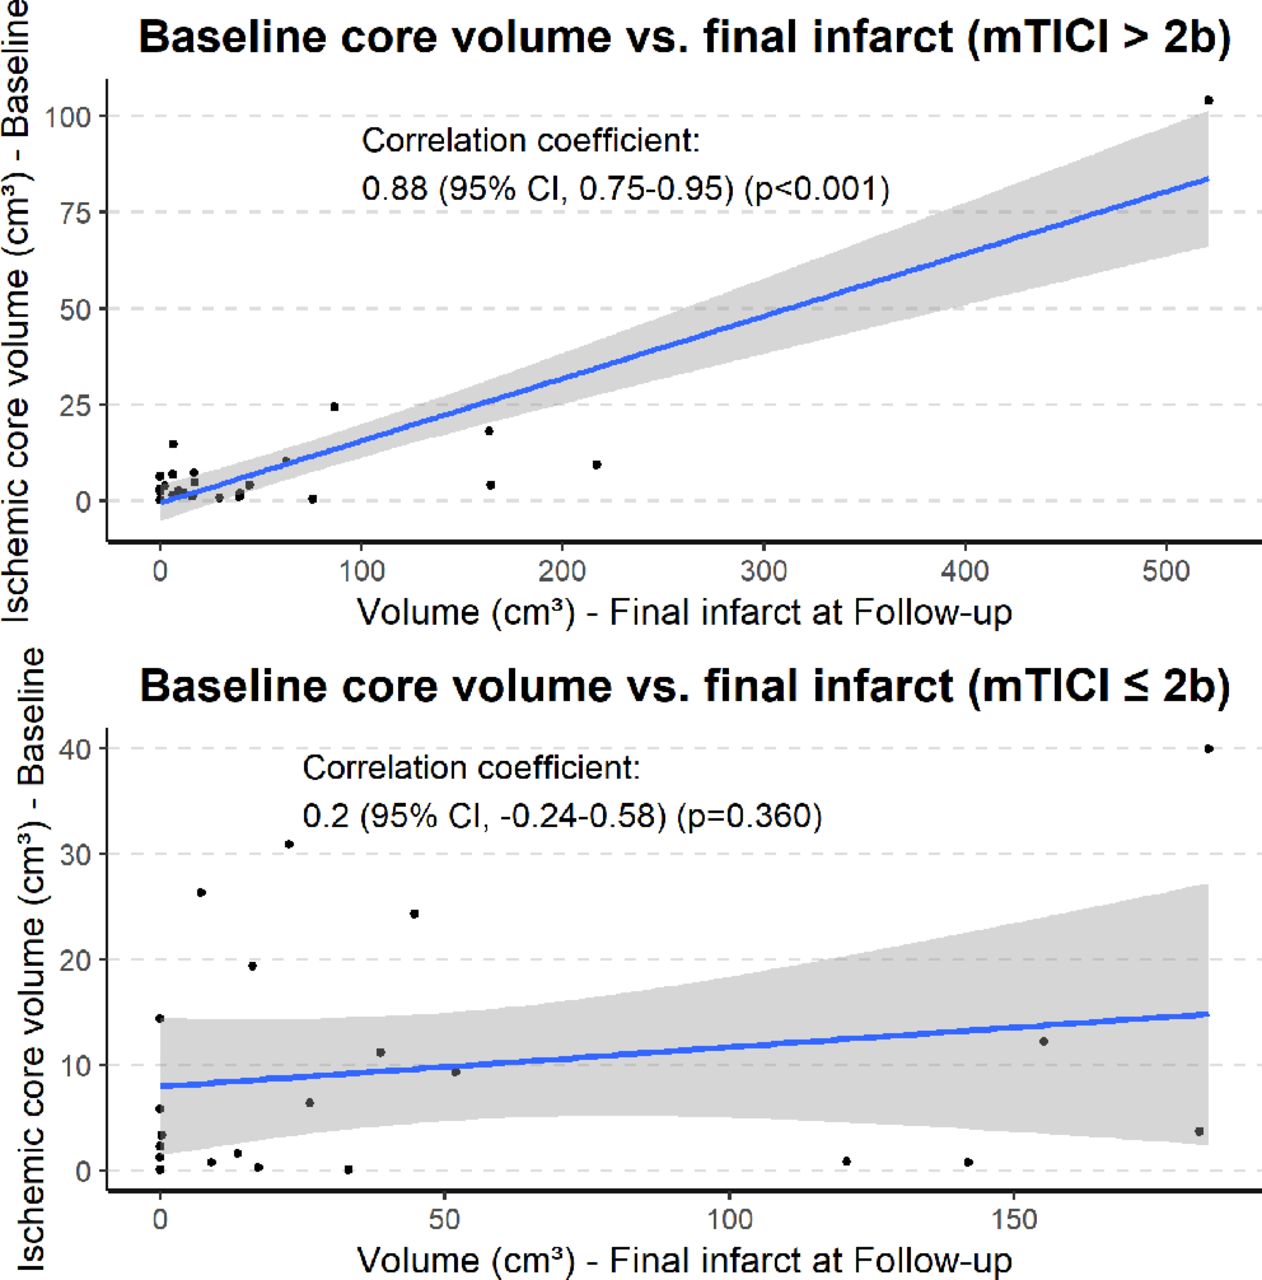
Finally, the baseline ischemic core volumes for patients who received complete recanalization demonstrated a significant correlation with the final ischemia at follow-up CT performed 18–36 hours after EVT (Pearson correlation coefficient of 0.88 (95% CI 0.75 to 0.95), P<0.001), whereas no significant correlation was found for patients with incomplete recanalization (Pearson correlation coefficient of −0.24 (95% CI −0.24 to 0.58), P=0.360) (figure 4).
Plotted correlations between baseline core volumes and final infarction, stratified by modified Treatment in Cerebral Infarction (mTICI) outcome.
Discussion
In this exploratory study we analyzed the dynamics in cerebral perfusion and oxygenation parameters after EVT in patients with AIS of the anterior circulation. By applying a combined CT/C-arm setting where CT imaging and EVT were performed on the same table, we demonstrated that EVT leads to an immediate quantitative reduction of the pathological Tmax values, which also corresponds to a significant volumetric decrease of the ischemic penumbra, thereby reflecting the physiological correlate of the successful mechanical restoration of cerebral perfusion. These differences were dependent on the extent of recanalization: patients with complete recanalization outcome (mTICI >2b) demonstrated significantly lower Tmax and ischemic penumbra after EVT as compared with those with incomplete recanalization (mTICI ≤2b), and presented also a relevant reduction in OEF as well as a normalization of the CTH, both suggesting a restored metabolic exchange.5 14 21 27 These changes were also reflected by significant improvements in MTT and, by definition, COV values.20 Interestingly, the extent of recanalization also affected quantitative perfusion metrics which are typically associated with the ischemic core (CBF). Moreover, while a greater reduction in the volume of the ischemic penumbra after EVT was associated with higher mTICI scores, we found no significant volumetric change in the ischemic core volumes after EVT between the two groups. Finally, the baseline ischemic core volume was closely correlated with the final area of infarction at the follow-up CT (18–36 hours) after EVT in patients with a complete recanalization outcome, whereas it presented no significant correlation in cases with an incomplete recanalization.
Ischemic core and penumbra constitute clinically and functionally the two main areas onto which the hypoperfused brain tissue is divided on detection of a vessel occlusion. In the critically hypoperfused ischemic core, tissue either (i) already underwent permanent ischemic damage, (ii) will soon undergo permanent infarction despite treatment or (iii) might present some possible viability in case of quick recanalization.2 In contrast, the ischemic penumbra is considered to be still virtually completely salvageable on quick interventional treatment, and has been the longstanding therapeutic target of stroke therapy.7 28 29 The ischemic core has been shown to be representative of the final infarct at follow-up imaging for patients who obtained interventional success with a complete recanalization,15–17 indirectly also suggesting that the penumbra is the true target of successful endovascular intervention.15–17 Indeed, the results of our study confirm these findings in a controlled prospective setting. In our cohort, relevant differences in the volume of penumbral tissue were found between subjects with a complete (TICI >2b) or incomplete (TICI ≤2b) recanalization, with a negative correlation with the mTICI score and a high correlation to the final infarct at follow-up. Moreover, the oxygenation metrics, which are considered to be the hallmark of tissue-at-risk in ischemic stroke, revealed a marked improvement in tissue oxygenation and capillary transit time for patients with a complete recanalization, demonstrating the successful restoration of the physiological oxygen exchange in the ischemic tissue and resulting in homogeneous capillary flow (represented by the normalized COV).5 14 21 The ischemic core, instead, demonstrated no relevant volumetric difference between the two cohorts, and presented no correlation to either the mTICI score or the follow-up infarct. These findings further demonstrate that while successful EVT can positively revert the hypoperfusion in the penumbral area, it does not appear to have a similarly relevant difference on the ischemic core, which is already in part irreversibly damaged, in accordance with retrospective data in the literature.15–17 However, it must be noted, as also mentioned by Goyal et al in a recent consensus statement,2 that not all tissue currently defined as ischemic core is permanently lost, and a portion of it can be salvaged through prompt recanalization, which might explain why relevant differences were also found in our cohort for CBF values.
Our results also suggest the utility of mTICI as a good measure of the interventional success on the ischemic penumbra. Here, while in our cohort the penumbral tissue was largely reduced with a successful recanalization of mTICI >2b and the final infarct was volumetrically similar to the initial core volume, the absence of complete reperfusion in mTICI ≤2b meant that the final infarction was also in part determined by the penumbral tissue remaining after intervention, as without successful reperfusion it eventually grew into ischemic core; hence, the baseline core volumes for these patients hence did not correlate to the final infarct volume. It must be said, however, that all patients in our study were treated within the standard therapeutic window, and not the extended time window (ie, DAWN/DEFUSE-3 trials), and further investigations are warranted to confirm our findings in the extended-window setting. In theory, since a thrombectomy candidate in the extended window would implicitly present a (preserved) tissue status similar to that of patients in the regular (<6 hours) time window through to an innate advantage (eg, favorable collateralization), our results should in theory be largely reproducible also in this context.
In a recently published article, Rubiera et al also performed a repeated CTP within 30 minutes of endovascular therapy, demonstrating its value as a surrogate marker of therapeutic success.19 Furthermore, the authors found that most patients presented at least some hypoperfusion after intervention despite successful recanalization. Here, we also confirmed this finding in an independent cohort, as our patients also presented some residual penumbral tissue even with complete recanalization. As suggested by the authors, we agree that microvascular distal embolization as well as edema and pericyte damage might play a role in determining the leftover penumbral tissue.30 Moreover, pathophysiological changes which lead to thrombus formation on a microvascular level in the ischemic area have been known to play an important role in determining the final stroke outcome and to develop in parallel, and partially independently, to the occlusion in the main vessel.31
Our study has limitations. First, the study was conducted on a small sample and a relatively large amount of data was lost due to acquisition complications such as movement artefacts. This unfortunately limited our capability to find meaningful associations with clinical outcome due to the insufficient test power for regression analysis; studies with a larger sample size might reveal relevant associations of CTP patterns to clinical outcome. Second, the CTP after intervention was acquired following repeated administrations of iodine contrast media. Acquisition of CTP immediately after intervention has only been described once in the literature, and no available software for calculation of CTP metrics have been validated to work in this setting to the best of our knowledge; this might have ultimately induced some noise in the calculations due to the remaining contrast in the brain parenchyma.32 We aimed at mitigating possible signal-induced errors as much as possible with a stringent selection of the final perfusion maps and visual inspection of the AIFs and contrast passage curves, as well as performing a normalization of the perfusion values with the contralateral healthy white matter, and the final quantitative changes after intervention ultimately reflected what was expected in this setting. However, we acknowledge that despite our best efforts there might be masked or unaccounted effects due to this issue. Third, in our study we applied the commonly used threshold of 30% for determination of the ischemic core on CBF. While the maps were visually checked for consistency, it is a well-known fact that an optimal method for determining the ischemic core is currently lacking, and the ischemic core as currently determined constitutes an unclearly defined area of tissue fate, not necessarily irreversibly infarcted in its entirety.2 Furthermore, the immediately post-interventional time window might have reduced our possibility to discern true tissue recovery from hyperemic post-ischemic tissue changes, which are known to be a prominent phenomenon following tissue ischemia.33 Further studies of tissue oxygenation at an extended time window might provide more insightful information.
In conclusion, our study demonstrates that the ischemic penumbra is indeed the true target of successful EVT, and largely determines its efficacy on a tissue level. Moreover, we demonstrate the validity of the mTICI score as a measure of interventional outcome at a tissue perfusion level.
Data availability statement
Data are available upon reasonable request by contacting the corresponding author.
Ethics statements
Patient consent for publication
Ethics approval
University of Heidelberg No. S-303/2014 and S-784/2018.
References
Supplementary materials
Supplementary Data
This web only file has been produced by the BMJ Publishing Group from an electronic file supplied by the author(s) and has not been edited for content.
Supplementary Data
This web only file has been produced by the BMJ Publishing Group from an electronic file supplied by the author(s) and has not been edited for content.
Footnotes
Twitter @GianBrugna, @vollmuthp
Contributors Research concept and design: PV, GB, MB. Data acquisition: all authors. Imaging data post-processing: GB, MAM, MF, UN. Data analysis and interpretation: GB, PV. Statistical analysis: GB, PV. Drafting the manuscript: PV, GB. Critical revision of the manuscript for important intellectual content: all authors. Responsibility for funding and supervision: PV.
Funding PV was supported by the Else Kroner-Fresenius Foundation (Else-Kroner Memorial Scholarship).
Competing interests Additionally, the authors disclose the following relationships with companies unrelated to this research project. SN: consultancy: Brainomix, Boehringer Ingelheim; payment for lectures including service on speakers' bureaus: Pfizer, Medtronic, Bayer AG. CH: consultancy: Brainomix, Oxford, UK; comments: <€10,000. CU: travel/accommodation/meeting expenses unrelated to activities listed: MicroVention, Stryker. SH: grants/grants pending: Deutsche Forschungsgemeinschaft (DFG) - SFB 1118. MB: board membership: Data and Safety Monitoring Board for Vascular Dynamics, Guerbet, Boehringer Ingelheim; consultancy: Codman, Roche Diagnostics, Guerbet, Boehringer Ingelheim, BBRaun, Merck; grants/grants pending: DFG, Hopp Foundation, Novartis, Siemens, Guerbet, Stryker, Covidien, EU; payment for lectures including service on speakers' bureaus: Novartis, Roche Diagnostics, Guerbet, Teva Pharmaceutical Industries, Bayer AG, Codman. MM: board membership: Codman; consultancy: Medtronic, MicroVention, Stryker; payment for lectures including service on speakers' bureaus: Medtronic, MicroVention, Stryker; grants/grants pending: Balt. *Money paid to the institution. JARP: payment for lectures including service on speakers' bureaus: Siemens; travel/accommodation/meeting expenses unrelated to activities listed: Stryker, MicroVention. PAR: consultancy: Bayer, Pfizer, Daiichi Sankyo; personal fees: Boehringer Ingelheim.
Provenance and peer review Not commissioned; externally peer reviewed.
Supplemental material This content has been supplied by the author(s). It has not been vetted by BMJ Publishing Group Limited (BMJ) and may not have been peer-reviewed. Any opinions or recommendations discussed are solely those of the author(s) and are not endorsed by BMJ. BMJ disclaims all liability and responsibility arising from any reliance placed on the content. Where the content includes any translated material, BMJ does not warrant the accuracy and reliability of the translations (including but not limited to local regulations, clinical guidelines, terminology, drug names and drug dosages), and is not responsible for any error and/or omissions arising from translation and adaptation or otherwise.