Article Text

Abstract
Background Endovascular thrombectomy has revolutionized the management of acute ischemic stroke and proven superior to stand-alone intravenous thrombolysis for large vessel occlusions. However, failed or delayed revascularization may occur as a result of a mismatch between removal technique and clot composition. Determination of clot composition before thrombectomy provides the possibility to adapt the technique to improve clot removal efficacy. We evaluated the application of diffuse reflectance spectroscopy (DRS) for intravascular determination of clot composition in vivo.
Methods Three clot types, enriched in red blood cells or fibrin or with a mixed content, were prepared from porcine blood and injected into the external carotids of a domestic pig. A guidewire-like DRS probe was used to investigate the optical spectra of clots, blood and vessel wall. Measurement positions were confirmed with angiography. Spectra were analyzed by fitting an optical model to derive physiological parameters. To evaluate the method’s accuracy, photon scattering and blood and methemoglobin contents were included in a decision tree model and a random forest classification.
Results DRS could differentiate between the three different clot types, blood and vessel wall in vivo (p<0.0001). The sensitivity and specificity for detection was 73.8% and 98.8% for red blood cell clots, 80.6% and 97.8% for fibrin clots, and 100% and 100% for mixed clots, respectively.
Conclusion Intravascular DRS applied via a custom guidewire can be used for reliable determination of clot composition in vivo. This novel approach has the potential to increase efficacy of thrombectomy procedures in ischemic stroke.
- thrombectomy
- stroke
- intervention
- technique
Data availability statement
Data are available upon reasonable request. Further data can be obtained by email request to the corresponding author.
This is an open access article distributed in accordance with the Creative Commons Attribution Non Commercial (CC BY-NC 4.0) license, which permits others to distribute, remix, adapt, build upon this work non-commercially, and license their derivative works on different terms, provided the original work is properly cited, appropriate credit is given, any changes made indicated, and the use is non-commercial. See: http://creativecommons.org/licenses/by-nc/4.0/.
Statistics from Altmetric.com
Introduction
Endovascular treatment (EVT) has revolutionized the management of acute ischemic stroke (AIS) caused by large vessel occlusions, and resulted in significantly improved clinical outcomes in this patient category.1–10 EVT has traditionally been performed either with a stent retriever, a self-expanding stent used to catch and retrieve the clot, or by contact aspiration of the clot using a large bore catheter.11 More recently, a combination of both techniques has proven successful in achieving fast revascularization.12 13 Regardless of which technique is used, achieving complete or near complete revascularization at the first attempt has been shown to result in a better clinical outcome and decreased mortality.14 15 However, despite the encouraging results of EVT, recanalization is not achieved in up to 20% of cases, and only about half of the patients have good functional outcome at 90 days, defined as 0–2 (functional independence) on the modified Rankin scale.1 16 This may, at least in some cases, be due to thrombectomy failure or a prolonged procedure with many failed attempts before clot removal.
A key determinant in the success rate of EVT is the composition of the occluding blood clot. Clots are mainly composed of fibrin and red blood cells (RBCs), but they also contain platelets and leukocytes as well as other important compounds such as von Willebrand factor, extracellular DNA and neutrophil extracellular traps.17–20 Fibrin clots are associated with lower revascularization rates21–23 and produce greater static friction against the vessel wall, making EVT more difficult. Furthermore, clots may become compacted with repeated thrombectomy attempts, leading to increased friction against the vessel wall.21 24 Stent retrievers and large bore contact aspiration catheters vary in their efficacy depending on clot type.25 26 Hence, the correct choice of EVT technique in relation to the clot composition is an important factor in EVT success. Pre-thrombectomy information on clot composition would enable a tailored EVT strategy. Even though data suggest that CT and MRI may, at least partially, predict clot composition,27 no technique for reliable intravascular detection of clot composition has yet been presented.
In this study, we hypothesize that the optical technique diffuse reflectance spectroscopy (DRS), applied in a guidewire-like endovascular device, can be used for intravascular determination of clot composition. The goal of this study was to investigate whether DRS can be used to discriminate between typical clot types, including RBC-rich clots, fibrin-rich clots and mixed clots, as well as blood and vessel wall. An experimental porcine model of AIS was used. The accuracy of the DRS method was first analyzed using a decision tree model, where the optical properties of defined tissue components were used for clot and tissue categorization. Second, because decision trees are prone to overfitting data, a random forest model was used to verify the clot and tissue identification accuracy.
Methods
DRS system and custom guidewire-like probe
In DRS biological tissue is illuminated with white light. Inside the tissue the light is scattered and absorbed. A part of the back-scattered light is collected and spectrally analyzed. The intensity and shape of the spectra are determined by the scattering properties of the examined tissue and its content of absorbers. Thus, a specific tissue produces characteristic reflected spectra that can be analyzed to determine the tissue composition. Since the optical properties differ between the constituents of a blood clot, such as RBCs or fibrin, it can be assumed that the reflected spectra from an RBC-rich clot will differ from the spectra reflected by a fibrin-rich clot.
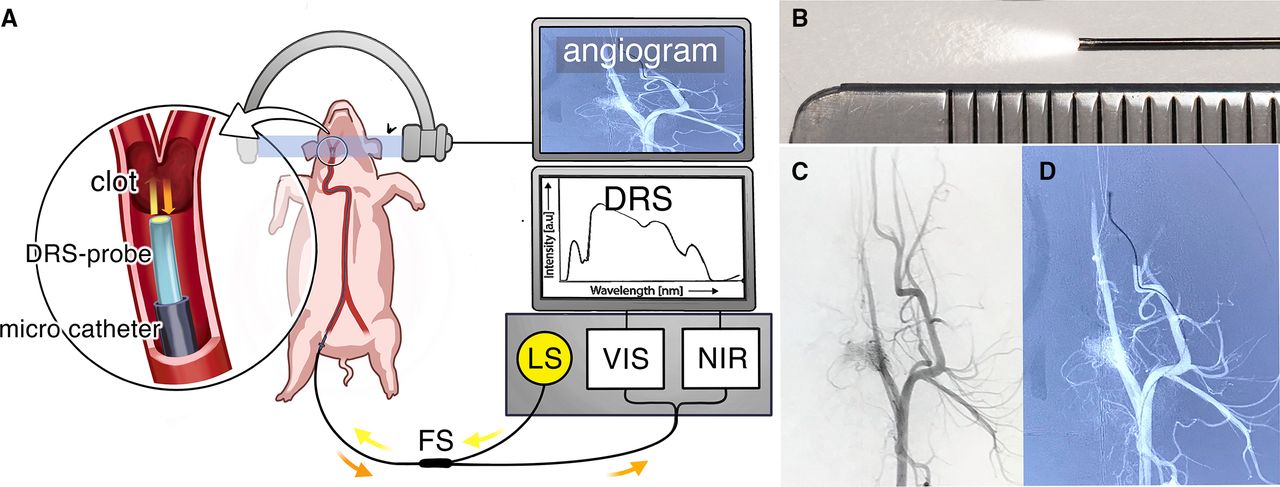
The general principles of DRS, instrumentation and calibration have been described previously28 and the experimental setup is schematically illustrated in figure 1. In short, light from a tungsten halogen broadband light source (360–2500 nm) is coupled to an optical multimode fiber (200 m diameter). The fiber forms the core of a custom-made, 1.5 m long, 0.014 inch (0.36 mm) diameter intravascular guidewire-like probe. The light exits the fiber at the tip of the probe (figure 1B), which is polished at a 15° angle to avoid back-reflection at the glass–tissue interface. Light from the tip is collected by the same fiber and guided via the other arm of the fiber splitter to two optical spectrometers (figure 1A). One spectrometer resolves light in the visible and near-infrared wavelength range of 450–1100 nm (OceanOptics Maya 2000PRO, Ocean Insight, Orlando, FL), while the other covers the infrared wavelengths from 900–1700 nm (OceanOptics NIRQuest512, Ocean Insight, Orlando, FL). For data acquisition and controlling of the spectrometers, a software developed in-house was used (C++).

The experimental setup. (A) A light source (LS) with light ranging from 360–2500 nm is coupled to a 200 µm diameter optical fiber, that forms the core of a custom-made, 1.5 m long, 0.014 inch (0.36 mm) diameter intravascular guidewire-like probe. The light exits the fiber at the tip of the probe and the reflected light, depicted in orange, is collected by the same fiber. The reflected light is guided via the other arm of the fiber splitter (FS) to two optical spectrometers, one covering visible and near-infrared wavelength range of 450–1100 nm (VIS) and one covering the near infrared and infrared wavelengths from 900–1700 nm (NIR). The spectra of the collected light represent the composition of the examined tissues, allowing identification of the examined tissue. (B) The tip of the custom 0.014 inch (0.36 mm) guidewire-like DRS probe next to a mm ruler. (C) Angiogram of the external carotid artery before and (D) after introduction of an obstructive clot. The DRS probe has been placed distal to the clot via a standard 0.021 inch (0.5 mm) microcatheter, and is slowly pulled back to read out the composition of the entire clot.
Animal preparation
The procedure was conducted according to the institutional guidelines for animal experiments and was approved by the regional ethics committee (N87/15 and N162/16). One adult 53.2 kg female Yorkshire pig was used and the whole procedure was performed under general anesthesia with sodium pentobarbital and mechanical ventilation. After the experiment the animal was euthanized using a lethal dose of sodium pentobarbital (100 mg/kg).
Clot preparation and validation
RBC, fibrin and mixed clots were prepared from porcine whole blood using a method described by Duffy et al.24 All clots were manufactured at room temperature in test tubes. RBC and fibrin clots were prepared from citrated, fresh porcine blood that was centrifuged at 1500 g for 15 min to separate RBC, plasma and buffy coat. For fibrin clots, a mixture of 20 mL plasma +1 mL calcium chloride (CaCl2) solution (8 g CaCl2·2H2O dehydrate in 100 mL water) was used, and for RBC clots a mixture of 20 mL RBCs + 1 mL CaCl2 was used. Mixed clots were formed in a static environment from the lighter layer of sedimented, citrated whole blood that was left to coagulate for 12 hours. After preparation, the clots were stored at −18°C for 7 days and thawed during 24 hours before the experiments were conducted. Before injection, a piece of each clot was separated for histological analysis. Briefly, clots were incubated in 4% formaldehyde solution in phosphate buffered saline at room temperature. The samples were then embedded in paraffin, cut into 5 µm sections, mounted on glass slides and stained with hematoxylin-eosin (H&E) and Martius scarlet blue (MSB). Quantification of the clot elements for each clot was performed by the study pathologist (OA), using conventional light microscopy. H&E staining allowed identification of RBCs and nucleated cells, such as leukocytes. Fibrin could to some extent be distinguished from platelets. MSB stains fibrin red, RBCs yellow and platelets lightly pink. In assessing the clot composition, staining was correlated to the structural morphology of each component.
Angiography, clot injection and DRS measurements
In a Philips Allura monoplane angiography suite, the right femoral artery was surgically exposed and arterial access was obtained using a 6 French (6F) short introducer sheath. A 6F guide catheter (Envoy, Cordis Endovascular Systems, Miami Lakes, FL), continuously flushed with saline containing 5000 IU of heparin/L, was placed in the external carotid artery (ECA). A piece measuring approximately 2–3 × 10 mm was cut from each clot type and introduced in a 20 mL syringe, which was subsequently attached to the guide catheter. Each clot was gently flushed into a distal branch of the ECA by physiological saline. Each clot resulted in an occlusion of a single ECA branch, and each ECA branch was used for one test only. Occlusions were achieved in the branches of the ECA, including the internal maxillary artery, ciliary artery and external ethmoid artery. The dimensions of the occluded vessels ranged between 1.5–3.0 mm. Tests were performed in the ECA bilaterally. The clots were not retrieved after testing. In total, nine clots were carefully injected: three RBC clots, three fibrin clots and three mixed clots. Angiograms were performed for localization and documentation of the occlusions. The DRS probe was introduced via a standard 0.021 inch microcatheter (Prowler Select Plus, Cordis Endovascular Systems, Miami Lakes, FL) which was navigated under road-map with a 0.014 inch (0.36 mm) guidewire (Transend Platinum-tip, Stryker Neurovascular, Fremont, CA) to a position with the tip clearly distal to the clot. The guidewire was then replaced by the DRS probe and the microcatheter withdrawn while the probe was kept in position distal to the clot. Finally, the DRS probe was slowly pulled back while DRS spectra were recorded in blood distal to the clot, inside the clot and in blood proximal to the clot, respectively. For each analyzed clot, 200 spectra, divided between the three probe positions, were recorded. DRS acquisition time was set to 0.45 s, and a full reading of 200 spectra lasted 90 s. At the end of the experiment, the tip of the DRS probe was navigated to a position perpendicular to and against the vessel wall, verified by an angiogram, and 230 separate DRS recordings of vessel wall were performed from eight different positions. Finally, the DRS spectra were reviewed. Only recordings free from movement artifacts, with clear and undistorted DRS spectra, and with a catheter position that could be unambiguously verified as in either blood, blood clot or vessel wall on the angiogram, were included in the data analysis.
Data analysis
Diffuse reflectance spectral data analysis
Spectral analysis was performed with a custom software using Matlab (MathWorks Inc, Natick, MA). DRS data acquired from the in vivo angiographic measurements were analyzed in the wavelength range of 400–1600 nm. A version of the optical model by Farrell et al was fitted to the measured spectra to extract parameters related to the physiological and morphological properties of tissue, as previously described.29–31 These parameters included the concentration of oxygenated hemoglobin and deoxygenized hemoglobin, methemoglobin, water and collagen, as well as parameters describing the wavelength-dependent scattering contributions from Mie and Rayleigh scattering.32 33 Typically, the Farrell model uses the distance between emitted and collected light beams. Since the DRS probe used in this study has a single fiber, an average distance of half the fiber diameter (=100 µm) was assumed.
Statistical analysis
Decision tree
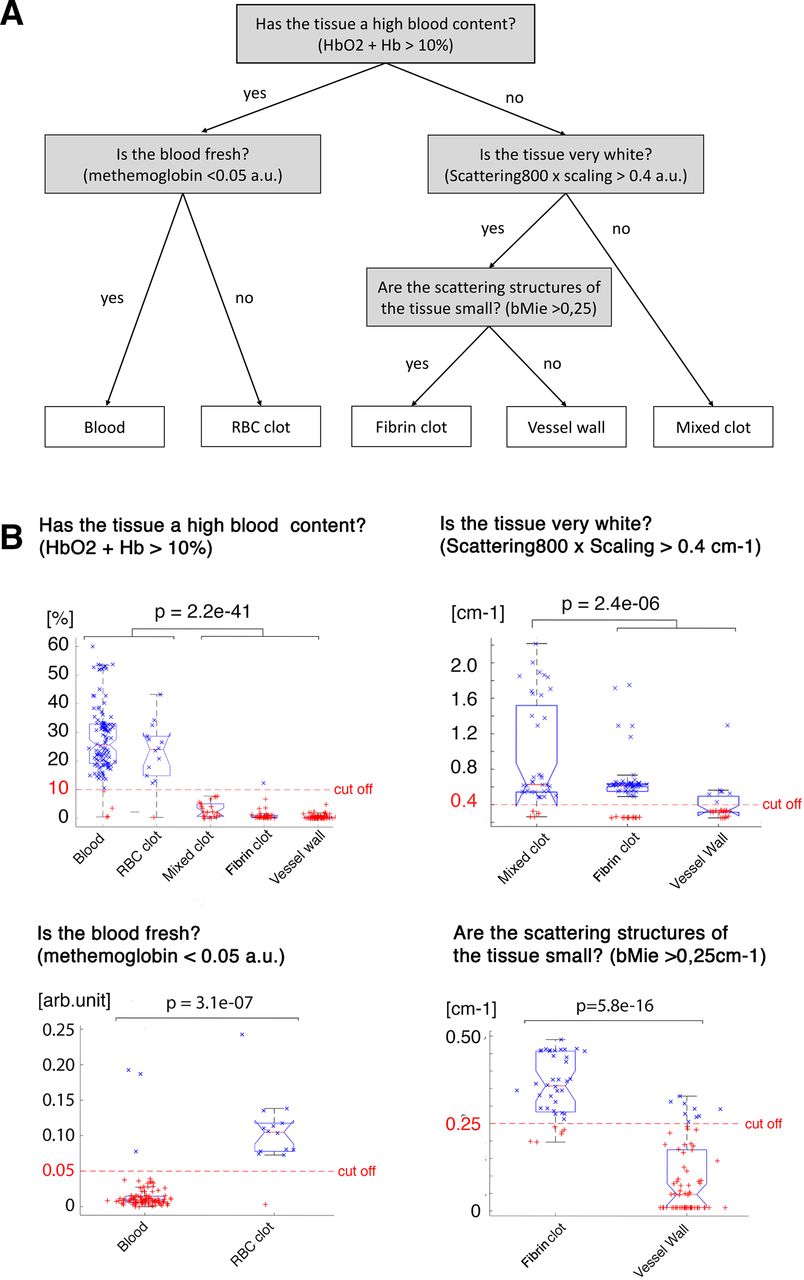
Histograms of the fitted parameters were reviewed and found not to be normally distributed. All individual spectra were randomly assigned to either a training set (n=289, 52%) or a validation set (n=266, 48%). The fitted parameters were reviewed to identify physiologically meaningful disparities and statistical differences, the latter using a non-parametrical (Kruskal-Wallis) one-way analysis of variance (ANOVA) test. Based on the training set, the parameters with the best discriminating features, that is, the most significant statistical differences between tissue types, were included in the decision tree. Cut off-values for every decision node were manually assigned to optimize discrimination between the tissue types. DRS recordings of the sum of oxygenated and deoxygenated hemoglobin (HbO2+Hb), reflecting content of blood, were used to discriminate RBC clots and blood from the other tissues, using a cut-off of 20%. RBC clots were split from blood based on methemoglobin content, with the cut-off value of 0.05 (arbitrary unit), since coagulated blood has a significantly higher content of methemoglobin than fresh blood. The light Scattering800*Scaling parameter, corresponding to the whiteness of the tissue, was used to split fibrin clot and vessel wall from mixed clot, with a cut-off of 0.4 cm-1. The Mie slope parameter bMie, roughly corresponding to the size of the scattering structures, was used to differentiate fibrin clots from vessel wall, with a cut-off value of 0.25 cm-1. Finally, the decision tree was tested with the validation set. To evaluate the statistical differences between the split parameters at each decision node, a non-parametrical (Kruskal-Wallis) one-way ANOVA test was used for nodes with three or more classes, and a two-sided Wilcoxon rank sum test was used for nodes with two classes. The specificity and sensitivity of the method was calculated from a confusion matrix.
Random forest
Since decision trees are prone to overfitting data, an independent validation of the results was performed using a random forest classification.34 For training of the random forest model, RStudio (RStudio Team. RStudio: Integrated Development for R. RStudio, Inc, Boston, MA) and the random forest package were used.35 A 10-fold cross-validation method for training the classification models was employed. In each round of training, 500 decision trees were generated. After training, the overall accuracy of the model, as well as the specificity and sensitivity for detection of each tissue type, were calculated based on the confusion matrix of the validation data.
Results
Histological clot composition verification
Histological examination revealed a typical pattern in the RBC-rich clots in which the composition was estimated to 80% RBCs, 15% fibrin, 5% platelets and <1% leukocytes. The fibrin-rich clots were almost exclusively composed of fibrin (>95%) with only focally scattered leukocytes (<5%) and no evident RBCs or platelets. The mixed clots showed a meshwork of fibrin of varying density, lake-like aggregates of platelets and a uniform distribution of small, mature lymphocytes, occasional neutrophilic granulocytes and no RBCs. The composition was estimated to 80% fibrin, 20% platelets and <1% leukocytes. Gross photographs and histomorphology at 400× (H&E) of the clot analogs are presented in figure 2A.

Clot analog characterization and averaged DRS spectra. (A) Gross photographs and histomorphology at 400x (H&E) of the clot analogs. The RBC clot was dark red/burgundy on macroscopic examination and contained approximately 80% RBCs. Thin fibrin strands made up about 15% of the clot. Small clusters reminiscent of platelets were seen, constituting <5%. Scattered lymphocytic cells and neutrophilic granulocytes were identified. The mixed clot was light red to pink and contained a fibrin network of both thin, loosely connected fibrin strands and areas with coarse fibrin bundles. Fibrin content was estimated to be 80%. Lakes of what was perceived as platelets constituted about 20% of the clot. Single small, mature lymphocytes were seen. No red blood cells were identified. The fibrin clot was white and contained a fine fibrin network with cavities of varying size. Scattered lymphocytic cells were seen but there were no red blood cells or areas resembling platelets. These findings suggested a >95% fibrin composition. (B) The averaged spectra of the clot types, blood and vessel wall. Intensity is presented on the y axis in arbitrary units (a.u.) and wavelength in nm is presented on the x axis. The DRS spectra of clot types, blood and vessel wall are different, allowing tissue identification. DRS, diffuse reflectance spectroscopy; H&E, hematoxylin-eosin; RBC, red blood cell.
DRS recordings in the experimental model
The DRS probe was easily positioned using a standard 0.021 inch (0.5 mm) microcatheter and clearly visualized with fluoroscopy. No intraoperative complications were noted. In total, 2030 spectra were recorded. Since the DRS measurements were recorded continuously during each pullback session, a large number of recordings had artifacts or distortions of the spectra, especially as the catheter passed the transition between blood and clot, both distally and proximally. Recordings where the catheter position was not unambiguously placed in either blood, clot or against the vessel wall were also excluded. Due to the pullback technique employed, a majority of the readings were from blood distal or proximal to the clot. To avoid imbalance in the training dataset, 75% of the blood readings were excluded. Finally, 555 spectral recordings were included in the data analysis: blood n=266, RBC clot n=33, mixed clot n=42, fibrin clot n=62, and vessel wall n=152. The averaged spectra from the individual clot and tissue types are presented in figure 2B.
Decision tree
In the manually designed decision tree each decision node corresponds to a fitted physiological parameter with a chosen cut-off value (figure 3A). The chosen parameters and cut-off values could reliably discriminate between the different clot and tissue types, as presented in figure 3B. Blood and RBC clots were discriminated from the other tissues (p<0.0001), blood and RBC clots from each other (p<0.0001), mixed clots from fibrin clots and vessel wall (p<0.0001), and finally fibrin clots and vessel wall from each other (p<0.0001). Table 1 shows the resulting confusion matrix when the model was tested with the validation dataset. The rows represent the model’s classification of the tissues and the columns the actual tissue types, with correct DRS readings presented on white background. From the confusion matrix, the sensitivity and specificity of the model’s prediction of each tissue type were calculated, as presented in table 2. Sensitivity and specificity of the decision tree model for detection of the individual clot and tissue types ranged between 69.6–94.0% and 92.2–99.3%, respectively.

The manually designed decision tree. (A) Each decision node corresponds to a physiologically meaningful splitting feature derived from the optical properties of a defined tissue component. Cut-off values are presented at the nodes. (B) The result of the classification at each decision node presented as boxplot diagrams, where the distribution of the fitted parameters is plotted for each tissue type. The red, dashed line represents the chosen cut-off value, and the p value describes the statistical significance of the difference between the discriminated classes at each node. arb.unit., arbitrary units; bMie, Mie slope parameter; HbO2 + Hb, oxygenated and deoxygenated hemoglobin; RBC, red blood cell.
Confusion matrix of the decision tree model
Accuracy of the decision tree model
Random forest classification
The same fit parameters used in the decision tree model, that is, blood (HbO2+Hb), methemoglobin, scattering800*scaling and bMie scattering, were included in the random forest classification. The resulting confusion matrix is presented in table 3, where the model’s classifications of the DRS readings are presented in the rows and the actual clot and tissue types in the columns, with the correctly classified values presented on white background. Sensitivity and specificity for detection of each individual tissue ranged between 73.8–100% and 96.0–100%, respectively, as presented in table 4.
Confusion matrix of the random forest classification
Accuracy of the random forest model
Discussion
In this study, a novel application of DRS for intravascular determination of blood clot type is presented. The technique could differentiate RBC-rich, fibrin-rich and mixed clots, as well as blood and vessel wall, with high accuracy. In general, data analysis using a random forest model produced better accuracy than a manually designed decision tree, with sensitivity and specificity values for identification of clot and tissue types ranging between 73.8–100%. Overall, the results indicate that intravascular DRS can be used to determine blood clot type in a mechanical thrombectomy scenario.
Clot composition has been shown to impact the prognosis for AIS patients treated with thrombectomy,12–14 27 and different thrombectomy techniques are better suited for different clots. Adapting the thrombectomy technique to match the clot type would work towards achieving first-pass-effect (FPE) in every case, that is, complete revascularization in one attempt.5 FPE has been shown to result in better clinical outcomes and cost savings.28 29 For RBC-rich clots, FPE may be achieved with the simpler and cheaper30 contact aspiration technique in combination with a balloon-guide catheter. The use of technically challenging and expensive combination techniques such as BADDASS31 can be limited to fibrin-rich and mixed clots. For fibrin-rich clots, contact aspiration may be ineffective and necessitate conversion to rescue therapies such as the newly developed ‘GCS-Nimbus’32 or rescue stenting, which has been shown to be superior to leaving a large vessel occluded.36 Any such modification of thrombectomy technique based on clot type requires an accurate method to determine clot composition. To date, no such method is clinically available.
The available methods for determination of clot composition in AIS patients have so far been limited to conventional diagnostic neuroradiology. The hyperdense middle cerebral artery sign on CT and blooming artifact/susceptibility vessel sign on gradient-echo MRI have been correlated to high RBC content of the clot27 37 and a better chance of revascularization.16 25 38 Several techniques to enable intravascular clot composition analysis have been studied. Spectral optical coherence tomography (OCT),39 its extension optical coherence elastography, and ultrasound shear wave elastography40 have been evaluated for determination of clot RBC content and mechanical properties of clot analogues in vitro. Electrochemical impedance spectroscopy has also been suggested for this purpose.41 Even though results are promising, further development of these methods are needed before they can be applied in a catheter-based technique for neurointerventional use. To the best of our knowledge, the DRS technique described in this paper is the only method for intravascular clot composition detection that has been successfully applied in an in vivo experimental stroke model.
The DRS technique has several beneficial features for intravascular clot measurements. The single optic fiber used in DRS can be easily mounted on a regular micro guide wire, there is no need to flush the clot area free from blood before the test (as opposed to OCT39), and the strong optical absorption features of blood clots can be taken advantage of, as DRS employs optical rather than electrical spectroscopy. Also, the spectral data provided by DRS allows for development of algorithms for automated interpretation. In this proof-of-concept study, we show that DRS can be used to differentiate between RBC-rich, fibrin-rich and mixed clot analogs. DRS has previously been used to identify a wide variety of tissues including fat42 and bone of different densities.33 43 Even though not tested in this paper, based on the results from the current and previous studies on DRS, it is highly probable that an algorithm for detection of atheromatous plaques and calcifications as in intracranial atherosclerotic disease can be developed as well.
A possible drawback with the DRS technique described in this study is that the probe is positioned distally to the clot by means of a standard microcatheter and then pulled back, meaning an extra microcatheter passage through the clot, or rather between the vessel wall and the clot, is required as this is the route that the microcatheter usually takes. The negative effects of repeated device passages may also apply to the retrograde passage of the DRS micro probe itself, even though this slender guidewire-like probe cannot be directly compared with passage with a microcatheter or a thrombectomy attempt by a stent retriever. Alternative ways of DRS recording where the clot is not passed could be considered, for example, recording while pushing the probe only into the proximal end of the clot.
In a real-life thrombectomy scenario, brain tissue is threatened by ischemia and any delay to revascularization increases the risk of cerebral infarction. In this context, it is noted that DRS recordings are fast. In this study a large number of DRS recordings (n=200) were performed for each clot, and yet the measurement time was approximately 90 s. Arguably, this procedural delay will be acceptable in most cases, and in cases where the clot analysis results in a more efficient clot removal this delay will be well compensated. In addition, the number of spectral recordings performed for each clot in this study served to collect large amounts of data rather than provide sampling for a rapid determination of clot type. For use in a clinical setting, the device and interface must be further developed with optimization for accuracy and speed, automatic automated analysis of the DRS data and feedback in real-time.
Limitations
This study was conducted in an experimental animal model, with blood clot analogs created in a controlled laboratory environment. In real life, blood clots are less homogeneous. Further studies on human ex vivo tissue is planned as a first step to validate the result in a clinical setting. This is a proof-of-concept study of DRS as a suitable technique for intravascular clot composition determination; however, the sample size was limited, and further studies with larger sample sizes are warranted to get a more robust estimate of the accuracy of the technique.
Conclusions
Intravascular DRS with a guidewire-like probe can be used for reliable in vivo determination of clot composition in a porcine model of mechanical thrombectomy. To the best of our knowledge, this is the first time intravascular clot composition detection has been reported in an in vivo experimental stroke model. This novel approach has the potential of improving efficacy of thrombectomy procedures and patient outcomes in AIS as well as saving costs.
Data availability statement
Data are available upon reasonable request. Further data can be obtained by email request to the corresponding author.
Ethics statements
Patient consent for publication
Ethics approval
The procedures in this study were approved by the Stockholm ethical committee, Stockholms tingsrätt, Box 8307, 104 20 Stockholm (N87/15 and N162/16).
References
Footnotes
Contributors Study conception and design: All authors. Preparation of blood clots: MM, GL. Conduction of animal experiments: SS, FA, TA, MM, MO, GL. Histopathological exam of clot; OADRS data analysis/parameter fitting: MM, GL. Analysis and interpretation of data: All authors. Draft of manuscript: SS. Critically revising the manuscript for important intellectual content: All authors. Final approval of the version to be published: All authors. All authors agree to be accountable for all aspects of the work in ensuring that questions related to the accuracy or integrity of any part of the work are appropriately investigated and resolved.
Funding The authors have not declared a specific grant for this research from any funding agency in the public, commercial or not-for-profit sectors.
Competing interests TA holds equity for Ceroflo and is a consultant for Amnis Therapeutics, Anaconda, Cerenovus-Neuravi, Medtronic, Rapid Medical and Stryker. None of the authors who are affiliated with clinical institutions or universities (SS, GB, EE, OA, AE-T, FA, TA) have financial interests in the subject matter, materials, or equipment or with any competing materials and did not receive any payments from Philips. Karolinska University hospital and Philips Healthcare have a major collaboration agreement. The authors affiliated with Philips Research and Philips Healthcare (MM, GL) have financial interests in the subject matter, materials, and equipment, in the sense that they are employees of Philips. Philips provided support in the form of salaries but did not have any additional role in the study design, data collection and analysis, decision to publish, or preparation of the manuscript. The specific roles of these authors are articulated in the ‘author contributions’ section. Authors without conflicts of interest had full control of all data labeling, data analysis and information submitted for publication and over all conclusions drawn in the manuscript.
Provenance and peer review Not commissioned; externally peer reviewed.