Article Text

Abstract
Purpose Newer flat panel angiographic detector (FD) systems have the capability to generate parenchymal blood volume (PBV) maps. The ability to generate these maps in the angiographic suite has the potential to markedly expedite the triage and treatment of patients with acute ischemic stroke. The present study compares FP-PBV maps with cerebral blood volume (CBV) maps derived using standard dynamic CT perfusion (CTP) in a population of patients with stroke.
Methods 56 patients with cerebrovascular ischemic disease at two participating institutions prospectively underwent both standard dynamic CTP imaging followed by FD-PBV imaging (syngo Neuro PBV IR; Siemens, Erlangen, Germany) under a protocol approved by both institutional review boards. The feasibility of the FD system to generate PBV maps was assessed. The radiation doses for both studies were compared. The sensitivity and specificity of the PBV technique to detect (1) any blood volume deficit and (2) a blood volume deficit greater than one-third of a vascular territory, were defined using standard dynamic CTP CBV maps as the gold standard.
Results Of the 56 patients imaged, PBV maps were technically adequate in 42 (75%). The 14 inadequate studies were not interpretable secondary to patient motion/positioning (n=4), an injection issue (n=2), or another reason (n=8). The average dose for FD-PBV was 219 mGy (median 208) versus 204 mGy (median 201) for CT-CBV. On CT-CBV maps 26 of 42 had a CBV deficit (61.9%) and 15 (35.7%) had a deficit that accounted for greater than one-third of a vascular territory. FD-PBV maps were 100% sensitive and 81.3% specific to detect any CBV deficit and 100% sensitive and 62.9% specific to detect any CBV deficit of greater than one-third of a territory.
Conclusions PBV maps can be generated using FP systems. The average radiation dose is similar to a standard CTP examination. PBV maps have a high sensitivity for detecting CBV deficits defined by conventional CTP. PBV maps often overestimate the size of CBV deficits. We hypothesize that the FP protocol initiates PBV imaging prior to complete saturation of the blood volume in areas perfused via indirect pathways (ie, leptomeningeal collaterals), resulting in an overestimation of CBV deficits, particularly in the setting of large vessel occlusion.
- Stroke
- CT perfusion
- CT Angiography
- CT
This is an Open Access article distributed in accordance with the Creative Commons Attribution Non Commercial (CC BY-NC 3.0) license, which permits others to distribute, remix, adapt, build upon this work non-commercially, and license their derivative works on different terms, provided the original work is properly cited and the use is non-commercial. See: http://creativecommons.org/licenses/by-nc/3.0/
Statistics from Altmetric.com
Introduction
Flat panel detector (FD) technology has been introduced into many biplane angiographic systems for use in diagnostic and therapeutic procedures. These detector systems allow the acquisition of datasets that can be reconstructed into CT-like images.1–7 When coupled to intravenous contrast injections, parenchymal blood volume (PBV) maps can be generated to provide an approximation of cerebral blood volume (CBV).8–11 The ability to rapidly generate CBV maps in the angiographic suite could greatly facilitate the rapid triage and endovascular treatment of patients with acute ischemic stroke (AIS) secondary to large vessel occlusion (LVO).
We present a prospective study comparing FD generated PBV maps with conventional CBV maps derived from standard CT data post-processed into dynamic perfusion maps using commercially available software in a cohort of patients with stroke.
Methods
Study patients
Fifty-six patients with cerebrovascular ischemic disease at two participating institutions prospectively underwent both standard dynamic CT perfusion (CTP) imaging followed by FP-PBV imaging (syngo Neuro PBV IR; Siemens, Erlangen, Germany) under a protocol approved by both institutional review boards. Two groups of patients were recruited for enrollment into the study: (1) acute patients, presenting with ischemic stroke with symptoms of less than 24 h in duration and (2) non-acute patients, presenting more than 24 h after the onset of stroke symptoms. All patients enrolled underwent conventional CT imaging with dynamic CTP as part of their routine clinical care. Acute patients underwent FD-PBV imaging within 3 h of their conventional CT study. Non-acute patients underwent FD-PBV imaging within 12 h of their conventional CT study.
Conventional dynamic CTP imaging
Conventional dynamic CTP was performed using standard institutional protocols. Source data from CTP examinations were transferred to, and stored on, research workstations corresponding to the system on which the imaging was performed (General Electric Medical Systems, Milwaukee, WI, USA, Advantage Windows Workstation, CT Perfusion software V.3.0; Siemens Medical Imaging, Erlangen, Germany, syngo Neuro Perfusion CT).
FD-PBV imaging
FD-PBV imaging was performed on a biplane flat panel detector angiographic system (Axiom Artis Zee; Siemens Medical Imaging). FD-PBV imaging was performed with two rotations of the detector system. Initially, an 8 s mask dataset was acquired. Next, Ultravist 370 was injected through a large bore (preferably 16 gauge, antecubital) intravenous catheter at a rate of 4 mL/s for a total of 60 mL. This injection was followed with a 50 mL saline push at a rate of 4 mL/s. Dynamic bolus tracking digital subtraction angiography was performed in the lateral projection. When contrast was visualized within the jugular vein (usually <10 s from termination of the contrast infusion), the second rotation was triggered and a second 8 s rotation was performed. Data were then transferred to, and stored on, a freestanding research workstation (Leonardo; Siemens Medical Imaging). Datasets were post-processed (syngo NeuroPBV) into multiplanar, whole brain reconstructions (section thickness 10 mm). The angulations of the reconstructed datasets were matched to those of the index conventional CTP studies for the same patients.
Data analysis
The radiation doses for both conventional CTP and FD-PBV studies were recorded and compared. One observer rated both the CBV maps and the PBV maps for each patient. Maps were evaluated for the presence of any CBV defect as well as for a defect that was equal to, or larger than, one-third of the volume of the anterior cerebral, middle cerebral, and/or posterior cerebral vascular distribution. Using the conventional CTP derived CBV maps as the gold standard, the sensitivity and specificity of the PBV technique to detect (1) any blood volume deficit and (2) a blood volume deficit greater than one-third of a vascular territory were assessed.
Results
Patient and examination characteristics
A total of 56 patients were included in the study (average age 62.9 years, range 25–86 years; 26 men) over a 30 month study period. Fourteen PBV examinations were technically inadequate secondary to patient motion or positioning (n=4), a contrast injection issue (n=2), or other problem (n=8). Forty of the 56 patients had LVOs. Average time intervals between conventional CT based CBV and FD-PBV imaging were 77.8 min and 596.5 min, respectively, for patients in the acute and non-acute groups.
Radiation dose
The average dose for FP-PBV was 219 mGy (median 208) versus 204 mGy (median 201) for CTP CBV.
Sensitivity and specificity to detect CBV deficits
On CT-CBV maps, 26 of 42 had a CBV deficit (61.9%) and 15 (35.7%) had a deficit that accounted for greater than one-third of a vascular territory (figure 1). FD-PBV maps were 100% sensitive and 81.3% specific to detect any CBV deficit and 100% sensitive and 62.9% specific to detect any CBV deficit of greater than one-third of a territory. In the 32 patients with technically adequate examinations and LVOs, false positives were most prevalent. In patients with LVO, FD-PBV maps were 100% sensitive and 77.8% specific to detect any CBV deficit and 100% sensitive and only 55.6% specific to detect any CBV deficit of greater than one-third of a territory (figures 2, 3). In 10 patients without LVOs, FD-PBV maps were 100% sensitive and 85.7% specific to detect any CBV deficit and 100% sensitive and 77.8% specific to detect any CBV deficit of greater than one-third of a territory

A 40-year-old patient with an embolus to a distal left middle cerebral artery (MCA) branch resulting in an acute left frontal infarct. (A) Axial reconstruction of conventional CT derived cerebral blood volume (CBV) demonstrates a focal CBV defect within the left anterior frontal lobe. (B) Flat detector-parenchymal blood volume (FD-PBV) derived maps demonstrate a blood volume defect of identical configuration and volume in the same location. In patients without proximal large vessel occlusions, and particularly those with normal hemodynamics, perfused blood volume maps closely match CBV maps derived from conventional CT examinations.

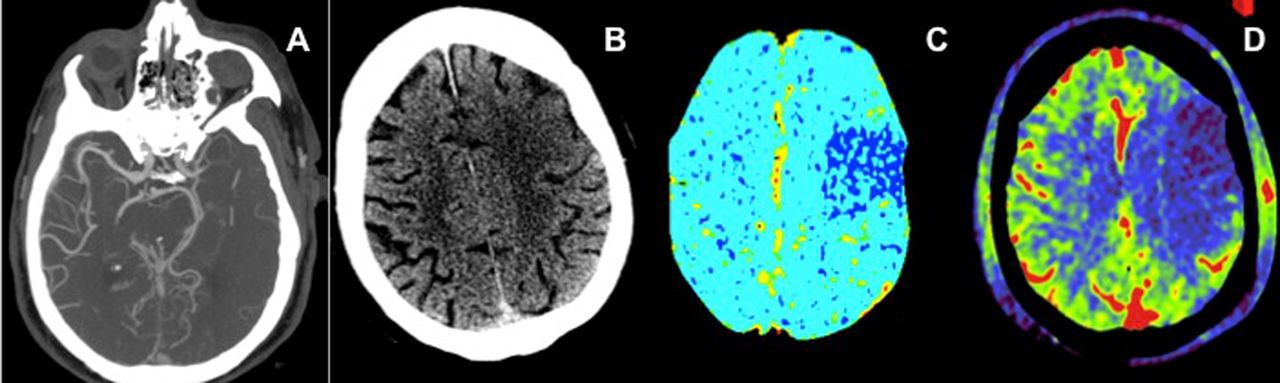
A 71-year-old patient with left middle cerebral artery (MCA) occlusion presenting with an acute left hemisphere syndrome. Reconstructed three-dimensional CT angiography images (A, arrow) and axial thick section reformations (B) show an occlusion of the M1 segment of the left MCA. Cerebral blood volume (CBV) maps derived from the conventional CT perfusion examination show no blood volume deficit in the affected territory (C), indicating that the patient might be an optimal candidate for thrombectomy. Three-dimensional reconstructions from parenchymal blood volume (PBV) source data also demonstrate the left M1 occlusion (D, arrow). However, flat detector PBV maps demonstrate a large deficit in perfused blood volume involving more than one-third of the left MCA territory (E, dotted oval). Following successful thrombectomy, the patient's symptoms resolved completely. Post-procedural MR diffusion study demonstrated only a tiny infarct involving the periventricular white matter but no injury within the remainder of the left MCA territory (F), confirming the findings on the conventional CT derived CBV study. This example demonstrates the capacity for PBV maps to overestimate the extent of CBV deficits in the setting of a proximal large vessel occlusion, particularly in an older patient with compromised cardiac output.

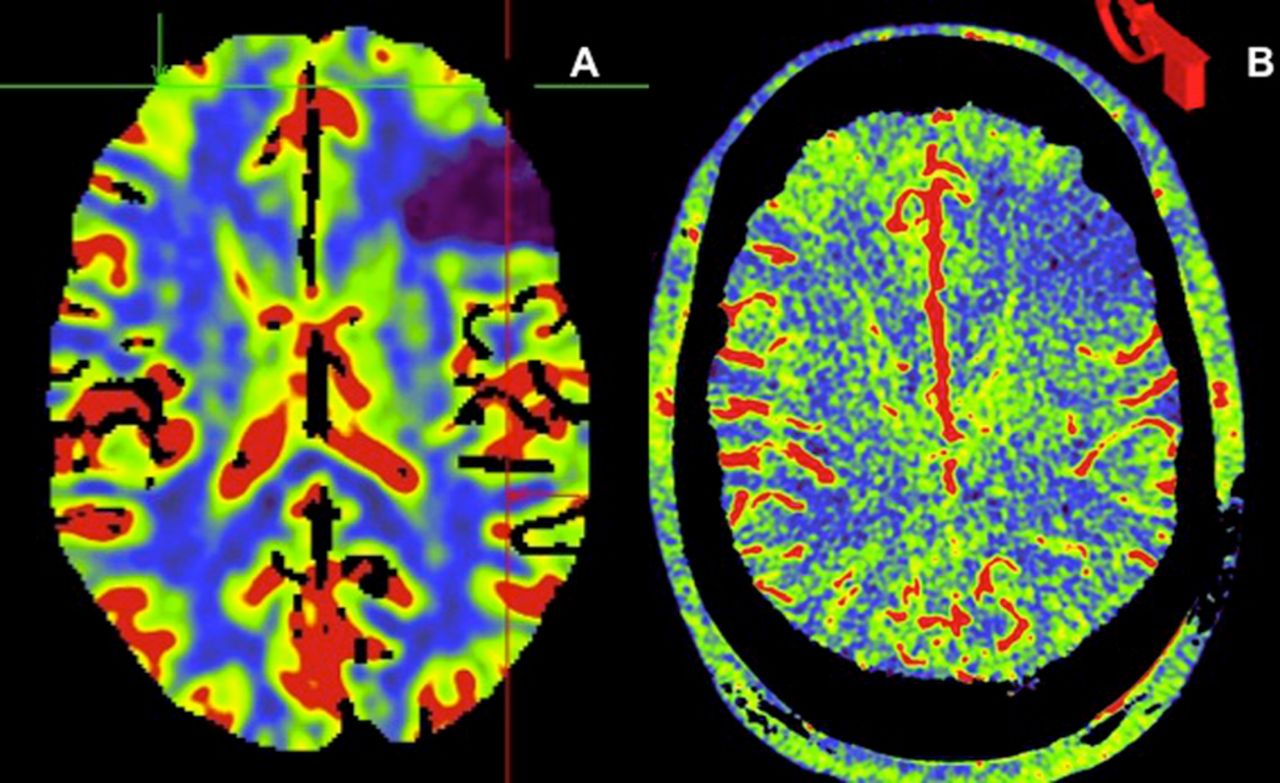
A 72-year-old with an occluded right middle cerebral artery (MCA) presenting with an acute right hemisphere syndrome. Axial reconstructions from the flat detector-parenchymal blood volume (FD-PBV) examination demonstrate a large right frontal lobe defect (A). Reconstructed source data from the FD-PBV examination confirm the right MCA M1 segment occlusion (B, arrow). Conventional CT derived cerebral blood volume (CBV) examination demonstrates no deficit within the right MCA territory (C). A region of interest placed on the conventional CT CBV map corresponding to this right frontal region (D) generates dynamic parenchymal enhancement curves which peak approximately 30 s after the initiation of imaging (E). FD-PBV imaging is initiated, on average, 20 s after the start of the contrast infusion, well before saturation of PBV. This example demonstrates the capacity for PBV maps to overestimate CBV deficits in the setting of a proximal large vessel occlusion, particularly in an older patient with compromised cardiac output and delayed flow.
Discussion
The present study was designed to assess the sensitivity and specificity of FD-PBV imaging to detect regions of reduced CBV in patients with stroke. The most important finding is that FD-PBV maps derived using the recommended imaging protocol may overestimate the presence and volume of CBV deficits in patients with LVOs. The application of these data for the selection of stroke patients for intervention could potentially influence the exclusion of patients who might otherwise be considered candidates for intervention based on CBV maps derived from conventional CT examinations.
Time from presentation to revascularization is a primary determinant of outcome in patients with AIS secondary to LVO.12 Significant time expenditure in stroke triage occurs during the course of neuroimaging. The ability of FD-CT to generate data that would allow the exclusion of patients who are otherwise appropriate candidates for endovascular stroke therapy would allow complete neuroimaging triage to be performed within the neuroangiography suite. In this scenario, patients with AIS from a suspected LVO could be transported directly to angiography where imaging would be performed with an immediate transition to endovascular stroke therapy if indicated. This type of protocol could substantially shorten door to femoral access times.
FD imaging currently has the potential to provide the parenchymal, vascular, and physiological imaging data required for stroke triage. Initial studies on FD-CT have demonstrated an adequate level of sensitivity and specificity for the exclusion of intracranial hemorrhage.13 ,14 FD-CT angiography (CTA) data can accurately identify LVO.15 FD-PBV imaging provides a possible mechanism by which to identify regions of parenchyma with reduced CBV which, on conventional CTP, are thought to indicate areas of completed core infarction.8 ,16–23 The present study was designed to provide a prospective comparison of FD-PBV maps with CBV maps generated using conventional CTP techniques in patients with cerebrovascular disease.
Radiation exposure is a growing concern in the diagnostic evaluation of patients.24 Radiation doses associated with FD-PBV studies were comparable with those of conventional CTP studies. The source data from the PBV examinations can also be used to generate CTA images. These CTA reconstructions from PBV source data are typically adequate to identify the location of a proximal LVO (figures 2, 3). For this reason there is a potential for reduced radiation exposure if the FD-PBV technique replaced both the conventional CTA and CTP examinations.
The FD-PBV protocol was sufficient to generate interpretable maps in the majority of patients. Technical failures were exclusively related to routine and preventable issues. These issues included patient motion, improper patient positioning, injector malfunction, and radiopaque objects extrinsic to the patients. In particular, extrinsic radiopaque objects and patient motion have the potential to create wedge shaped artifacts that can resemble defects in a vascular distribution (figure 4). With increasing experience generating and interpreting the FD-PBV maps, these issues would be expected to become less prevalent. In addition, if recognized at the point of post-processing, the examination could easily be repeated, provided that the added contrast load (60 mL) or radiation exposure did not represent a prohibitive concern.

A 76-year-old patient presenting with a symptomatic right carotid stenosis. Conventional CT derived cerebral blood volume maps demonstrate no deficits within the left hemisphere (A). MR imaging (not shown) confirmed that there was no stroke within the distribution of the left hemisphere. Flat detector-parenchymal blood volume (FD-PBV) map shows a wedge shaped PBV defect within the left anterior frontal lobe (B). Evaluation of the reconstructed source images demonstrates substantial patient motion with a significant misregistration of the native and subtracted post-contrast imaging, resulting in visualization of the soft tissue and bone structures on the three-dimensional reconstruction (in properly registered studies, these structures are subtracted out) (C).
FD-PBV maps had excellent sensitivity for the detection of any CT CBV deficit and as well as CT CBV deficits involving greater than one-third of a vascular territory. However, the specificity of FD-PBV maps was lacking. PBV maps sometimes demonstrated deficits that were not present on conventional CBV maps. PBV maps frequently overestimated the volume of existing CBV deficits mapped on conventional CT CBV (figures 2, 3, 5). These false positives were particularly prevalent in patients with LVO.
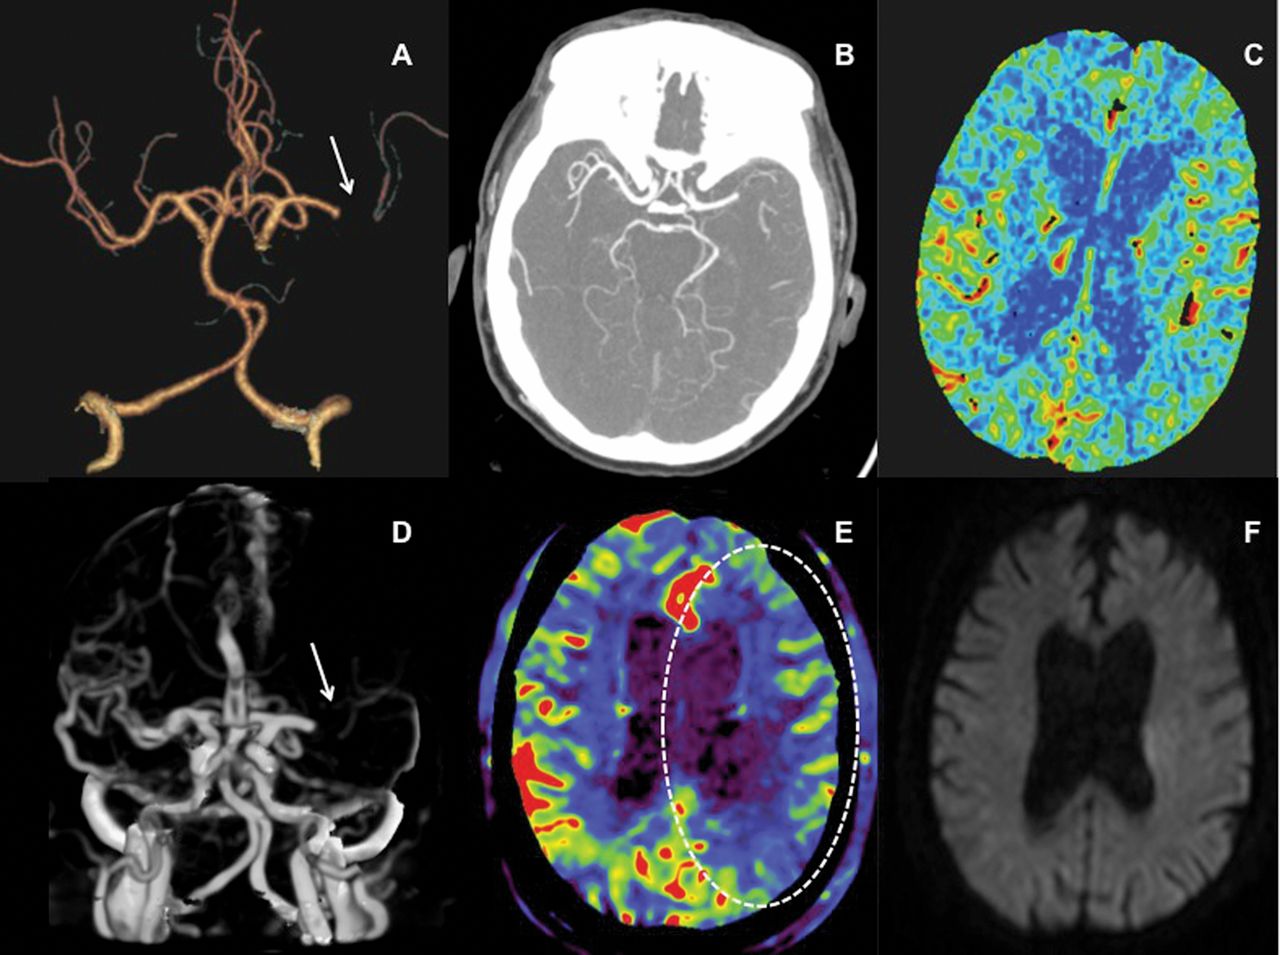
A 74-year-old patient with a proximal right M1 segment middle cerebral artery (MCA) occlusion presenting with an acute right MCA syndrome. Thick section axial reformations of CT angiography source data demonstrate occlusion of the right M1 segment (A). Conventional CT of the brain shows a subtle region of gyral swelling and loss of grey–white differentiation over the left frontal lobe (B). Conventional CT perfusion (CTP) derived cerebral blood volume (CBV) maps demonstrate a well demarcated deficit corresponding to the region of early stroke change on the plain CT head, involving less than one-third of the right MCA territory (C). Flat detector-parenchymal blood volume (FD-PBV) map of the same region demonstrates a much larger region of decreased blood volume, involving most of the right MCA territory (D). This example demonstrates the potential for FD-PBV maps to overestimate blood volume deficits in comparison with CBV maps derived from conventional CTP examinations in patients with proximal large vessel occlusion.
There are several potential causes for the overestimation of CBV deficits. First, due to the prospective design in which subjects were used as their own controls, patients underwent conventional scans first within the context of clinical care, followed by the FD-PBV scans. It is conceivable that during the time interval between these scans progression of the infarct (and corresponding CBV deficit) could have occurred. This did not appear to be the case in the present study, as analysis of the data demonstrated no correlation between the time interval between scans and degree of PBV deficit overestimation. Second, as the FD-PBV estimate of CBV relies on complete saturation of the parenchymal blood pool with contrast, it is likely that in many cases parenchymal imaging was initiated too early. In the current protocol, FD-PBV imaging is triggered by the first appearance of contrast within the jugular veins—an endpoint indicative of blood volume saturation within normally perfused vascular territories. In the present study, FD-PBV imaging was typically initiated between 18 and 22 s after the start of the contrast bolus. In patients with LVOs, parenchymal territories perfused indirectly (via leptomeningeal collaterals) could still be in the early stages of enhancement while normally perfused areas of brain had progressed into the venous phase. If parenchymal imaging were initiated at this stage, PBV could appear falsely depressed in these regions of brain with delayed perfusion and late saturation of the PBV (figure 3). Such a discrepancy could be further exaggerated in the presence of poor cardiac output or any other hemodynamic parameter that resulted in globally reduced cerebral perfusion (figure 5). It is likely that an extension of the contrast bolus and a commensurate increase in the delay before the inception of parenchymal imaging will allow for complete saturation of the blood pool in both normal and hypoperfused parenchyma in patients with LVO. This could improve the specificity of the FD-PBV technique for the detection of conventional CBV deficits.
Struffert et al15 ,16 compared FD-PBV maps with CBV maps generated using conventional CTP techniques and reported excellent agreement between the two techniques. However, the prior studies only included a handful (two of 25) of patients with LVOs—the remainder had intracranial or extracranial stenoses or aneurysms. Thus most subjects in the cohort studied did not have the circuitous patterns of perfusion observed in AIS patients with intracranial LVOs. For this reason, the potential for overestimation of PBV created by this physiology was not as evident. In the present study, the majority of patients had LVOs. Thus these data are more directly relevant to the application of FD-PBV for the triage of AIS patients.
There are several important limitations of the present study. First, all studies were interpreted by a single observer, a single time. As such, we have no quantification of inter- or intraobserver variability. Second, while some investigators have concluded that deficits on CBV maps correspond to infarct core, this concept remains controversial. The present investigation was designed to assess the correlation between FD-PBV maps and conventional CT generated CBV maps rather than to validate CBV maps as a measure of core infarct.17–19 ,25 ,26
In conclusion, it is feasible to generate FD-PBV maps within the context of routine clinical practice. The maps can be created with similar contrast and radiation exposure as those generated using conventional CT imaging techniques. The PBV technique requires that the entire CBV be saturated with contrast prior to the initiation of imaging. If parenchymal imaging is initiated too early, PBV maps will overestimate the volume and severity of CBV deficits derived from conventional CT datasets analyzed using deconvolution based software.
References
Footnotes
-
Contributors All authors have made substantial contributions to conception and design, acquisition of the data, or analysis and interpretation of the data.
-
Funding This research was supported by a grant from Siemens Medical Imaging.
-
Competing interests None.
-
Ethics approval The study was approved by the local institutional review boards.
-
Provenance and peer review Not commissioned; externally peer reviewed.