Article Text

Abstract
Purpose Monitoring of blood pressure (BP) during procedures is variable, depending on multiple factors. Common methods include sphygmomanometer (BP cuff), separate radial artery catheterization, and side port monitoring of an indwelling sheath. Each means of monitoring has disadvantages, including time consumption, added risk, and signal dampening due to multiple factors. We sought an alternative approach to monitoring during procedures in the catheterization laboratory.
Methods A new technology involving a 330 µm fiberoptic sensor embedded in the wall of a sheath structure was tested against both radial artery catheter and sphygmomanometer readings obtained simultaneous with readings recorded from the pressure sensing system (PSS). Correlations and Bland–Altman analysis were used to determine whether use of the PSS could substitute for these standard techniques.
Results The results indicated highly significant correlations in systolic, diastolic, and mean arterial pressures (MAP) when compared against radial artery catheterization (p<0.0001), and MAP means differed by <4%. Bland–Altman analysis of the data suggested that the sheath measurements can replace a separate radial artery catheter. While less striking, significant correlations were seen when PSS readings were compared against BP cuff readings.
Conclusions The PSS has competitive functionality to that seen with a dedicated radial artery catheter for BP monitoring and is available immediately on sheath insertion without the added risk of radial catheterization. The sensor is structurally separated from the primary sheath lumen and readings are unaffected by device introduction through the primary lumen. Time delays and potential complications from radial artery catheterization are avoided.
- Blood Pressure
- Catheter
- Angiography
- Device
This is an Open Access article distributed in accordance with the Creative Commons Attribution Non Commercial (CC BY-NC 4.0) license, which permits others to distribute, remix, adapt, build upon this work non-commercially, and license their derivative works on different terms, provided the original work is properly cited and the use is non-commercial. See: http://creativecommons.org/licenses/by-nc/4.0/
Statistics from Altmetric.com
Objective
Blood pressure (BP) monitoring is critical to safety during invasive catheterization (cath) procedures. Patients having diagnostic studies and interventions often have altered baseline BP, in addition to stresses caused by the procedures in awake patients or effects of anesthesia.
BP monitoring during cath procedures may be done via sphygmomanometry (BP cuff), typically on an arm, but monitoring is intermittent and is subject to well known error in overweight or atherosclerotic patients. If robust monitoring is desired, invasive measurements via separate radial artery catheterization (RAC) are needed. If a vascular sheath with a side port (SP) is used during the cath procedure, the SP is often used versus RAC. In time critical circumstances (eg, myocardial infarction or stroke, hemorrhage, etc), the SP compromise approach is often selected to save time. However, the sheath must be up sized and involves compromises with both the sheath and BP monitoring functions.1
A new device, the pressure sensing system (PSS) (Endophys Holdings, Dallas, Texas) became commercially available in January 2015 (figure 1). In order to compare BP readings of the PSS versus either a BP cuff or RAC, a group of patients having cath procedures with the PSS and simultaneous readings from both the PSS sensor and another of the above means were compared.

Pressure sensing system (PSS). The PSS contains an electronic blood pressure monitor (BPM) device mounted on an IV pole and a sheath (6 F size currently available) with a fiberoptic pressure sensor embedded in its wall (A). The sensor opens to the arterial lumen at the tip of the sheath (B). Sensor readings output to a display on the BPM that shows systolic, diastolic, and mean arterial pressures.
Materials and methods
As part of institutional acceptance procedures for PSS technology, 13 adults, unselected by age or sex, underwent angiography procedures using a 6 F PSS at one of nine sites between May 2015 and April 2016. All participants were neurointerventional physicians, and indications for the study included cerebral aneurysm, arteriovenous malformation, vasospasm, tumor, or stroke/transient ischemic attack. PSS use was primarily for evaluation purposes for device adoption.
Numbers of procedures performed per site varied from 1 to 5. Comparative data recorded for BP monitoring included simultaneous BP cuff readings and readings from a separately placed RAC. Readings from the PSS SP were not tested here. Choices of comparison approaches, if any, were at the discretion of the operating physician. Three patients at one site and one patient at a separate site underwent simultaneous monitoring from a RAC placed and subsequently monitored by an anesthesiologist. Pressures were recorded at the same times from the radial artery and from the PSS sensor. Since the RAC approach is the most robust comparable ‘gold standard’ for continuous BP monitoring, this was chosen for primary analysis.
A total of 61 recordings were obtained in this fashion. Two of the recordings were not included in this analysis due to an obvious error (mean arterial pressure (MAP) exceeded recorded systolic arterial pressure (SYS) on two RAC observations), and these values were discarded for both the PSS and the RAC. Therefore, the dataset includes 59 simultaneous observations in individual patients of SYS, diastolic arterial pressure (DIA), and MAP pressures from both a PSS and RAC. Analysis includes Pearson correlations between each reading: SYS, DIA, and MAP with each measurement modality. As correlations can be high without indication of the same actual values, mean values for each category are also presented.
Similar analysis was performed on the data involving 66 observations in 10 patients in whom simultaneous observations were made with the PSS sensor and a BP cuff. One patient had readings contributing to both datasets (RAC and BP cuff).
Results
Overall, correlations for PSS versus RAC were strongly positive (SYS r=0.918, p<0.0001; DIA r=0.636, p<0.0001, and MAP r=0.93, p<0.0001). Mean pressures observed in each category are shown in the table and are noted to generally reflect slightly higher values for SYS and slightly lower values for DIA in the sheath, with nearly identical MAP values.
Percentage difference was calculated for each category. Means for each comparison (PSS vs RAC) varied by 0.4% SYS and 9% DIA, and the difference for MAP was 3.6% (figure 2).

Bland–Altman plots; pressure sensing system (PSS) versus radial artery catheterization (RAC) means. Plots for the PSS–RAC comparison for mean arterial pressure (MAP). Based on the identity plots (top row), these measures appear to be in agreement—aside from the outlier—as they are wrapped tightly around the linear parent function. The Bland–Altman plots show consistent differences across the range of measures. Differences of only a few mm Hg are explainable by differences in measuring techniques between radial and femoral pressures and between fiberoptic sensors and analog chips mounted on an IV pole (see Discussion section). The RAC measurements for patient No 4 (outlier) were higher than the sheath measurements. Different symbols and colors each represent a different subject. Broken lines on Bland–Altman plots represent mean ±2SD. Similar results in the plots were shown on the systolic and diastolic values, but are not displayed due to space limitations.
One goal was to assess whether the PSS measurement tool can be used interchangeably with an RAC. That is, are they measuring the same quantity? Bland and Altman introduced a method for addressing such comparisons.1 A variation accounting for linked replicates was used to compare PSS SYS with RAC SYS, PSS DIA with RAC DIA, and PSS MAP with RAC MAP.2 The identity plots in figures 1⇑–3 show that the PSS and RAC measures wrapped tightly around the linear parent function, and the Bland–Altman plots show differences that were consistent in variance and magnitude. Some patients tended to have systematically larger or smaller RAC measures, represented by colored markers entirely above or below the linear parent function (see discussion).
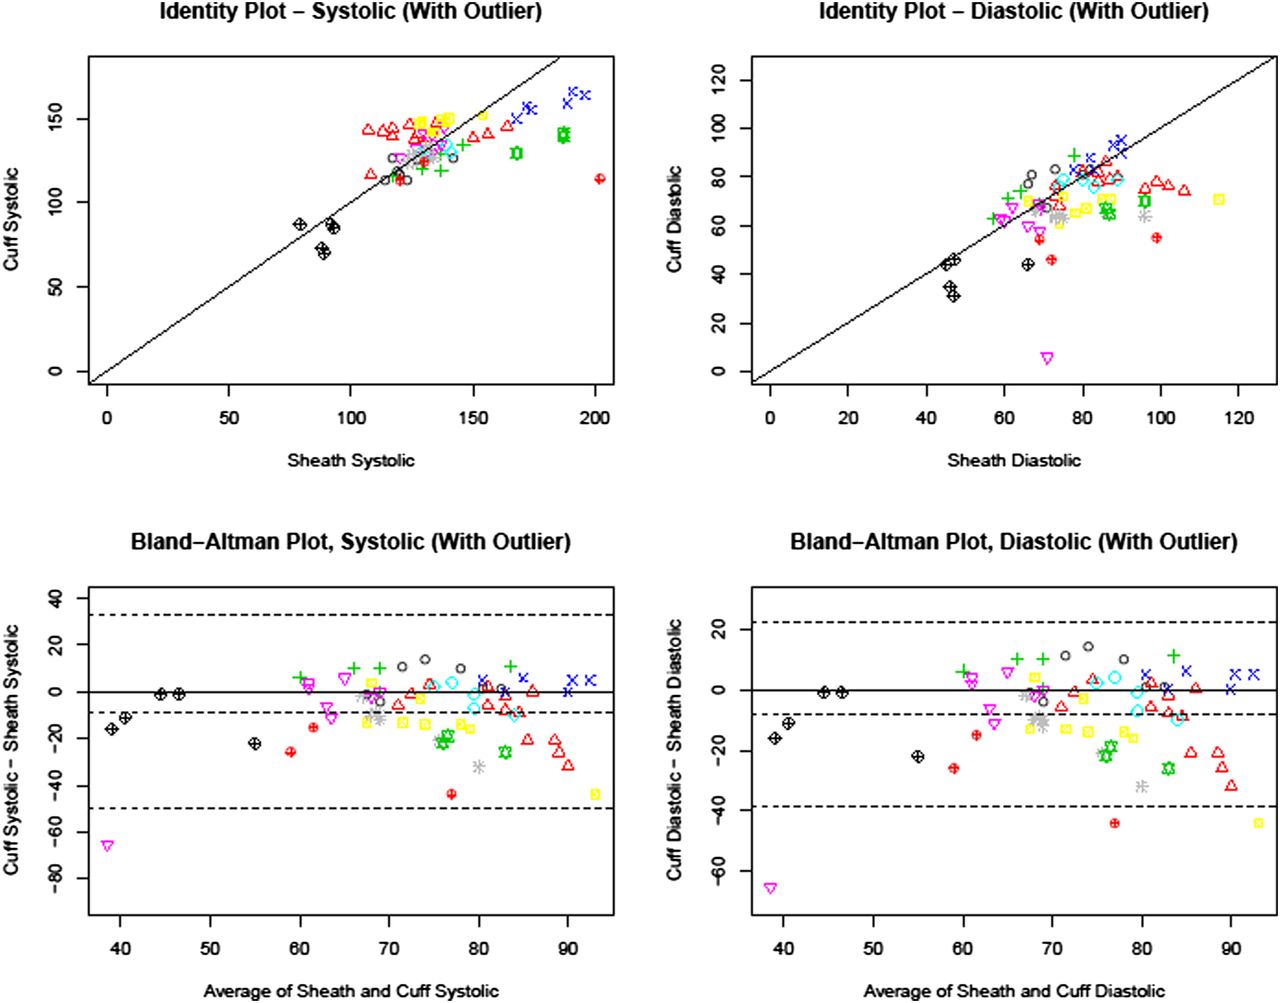
Bland–Altman plots; sheath versus cuff. Systolic comparison (left) suggests that higher pressure sensing system (PSS) measurements tend to correspond to lower cuff measurements (note that the patients have been marked by color and shape). The Bland–Altman plots tell a similar story—when the average of the two measurements is higher, the differences tend to be negative. An additional feature from these plots is that for more central systolic measurements (ie, 115–140 mm Hg), the differences are more likely to be positive. This suggests that the difference between the methods is not constant across all systolic blood pressure measures. If the difference between the methods was constant, we would expect a random scatter of points across the plot. The clinical significance of these differences should be considered in deciding which technique to use to monitor a particular patient procedure. The identity plot for the diastolic comparison (right, top) shows that the cuff measurements were often lower than the PSS readings, as a larger percentage of the points lie underneath the linear parent function. The Bland–Altman plot (right, bottom) shows that the differences have constant variance and are similar in magnitude across the range of measures, although the majority of them are below 0. On the basis of these plots it is reasonable to conclude that the PSS and cuff measurements are similar, although perhaps not measuring the same diastolic blood pressure.
During analysis, some anomalies were discovered. Patient No 3 had a PSS SYS reading of 165 but an RAC SYS reading of 105. The RAC measure appears inconsistent based on the previous measures for this patient. As such, the analysis for this comparison was run both with and without this value. Regarding DIA, patient No 3 also had three RAC measures that were inconsistent. These readings were 121, 95, and 85, respectively (both SYS and DIA readings identified as outliers are shown underlined and in bold type in table 1), compared with 68, 70, and 74 for the sheath readings. As these appeared to be more systematic differences, separate analyses for this comparison were not run. Regarding MAP, patient No 3 had an RAC reading of 126 compared with a sheath reading of 102. The elevated DIA outlier in that patient accounts for that calculated MAP value. The analysis for this comparison was run both with and without this value.
Results for PSS versus BP cuff were analyzed using the same technique. Again, correlations were positive for SYS, DIA, and MAP (SYS r=0.661, p<0.0001, DIA r=0.495, p<0.0001, and MAP r=0.34, p<0.002) although less so than with the RAC (values with the BP cuff tended to be lower than values with PSS) (figure 3).
Discussion
BP monitoring has become more invasive over the past several decades, owing to the increasing complexity of procedures over that time. However, the basic means of monitoring (BP cuff, RAC, or SP) has changed little in >50 years. RAC and SP monitoring both involve connection, via saline filled tubing, to a monitoring apparatus mounted external to the patient on an IV pole, which is itself connected electronically to a patient care monitor (PCM). The monitoring apparatus uses a mechanism known as a ‘Wheatstone Bridge’ (WB) (figure 4).

Fabry–Perot versus Wheatstone Bridge. (A) In the Wheatstone Bridge circuit, application of pressure alters the resistance across the circuit, and voltage change across resistors is used to calculate pressure. For more information, see: https://www.grc.nasa.gov/www/k-12/airplane/tunwheat.html. (B) In the Endophys sheath the sensor located near the tip (A–C) receives the light signal, which reflects from surfaces at the base of an air gap in the sensor and from the internal surface of the silicon diaphragm (D). The returning light contains bands of higher and lower intensity owing to the wavelength of the light and to diffraction across the air gap (interferometry), which alter as the space is altered by depression of the diaphragm by applied pressure. This allows calculation of the pressure at the diaphragm. For further information, see: https://en.wikipedia.org/wiki/Fabry–Pérot_interferometer.
In WB circuitry, a known voltage is emitted from the PCM to the WB chip mounted on the IV pole. As the WB distorts from the application of pressure via the fluid line from the patient, the electrical resistance is altered across the WB circuit, and the voltage returning to the PCM is altered proportional to the distortion of the WB. The input voltage is constant, and the signal from the WB is analog. Hence a tracing is produced on the PCM showing the height of the analog signal, and the peaks and troughs of pressure are averaged over a number of wave (pressure) cycles to give systolic and diastolic readings. MAP is typically calculated using an equation weighting the cardiac cycle as approximately 60% diastolic and 40% systolic,1 whereas the true MAP would be the arithmetic mean of the millisecond by millisecond measurement of arterial pressure, which is not available from analog waveform-type pressure readings. The BP readings using the WB method are actually readings of the pressure at the location of the chip on the IV pole, and may be artifactually high or low depending on the height of the placement of the WB device on the pole versus the location of the heart or by obstructions in the lumen of the catheter being used for the readings (thrombus in an RAC or sheath or a catheter within a sheath causing dampening of the pressure signal to the hub of the sheath from which the SP arises), or by dampening of the signal in the fluid line from the patient to the WB, such as might be produced by varying degrees of length or air in that fluid column.
The sensor in the PSS is a Fabry–Perot fiberoptic sensor, measuring 330 µm diameter. In the PSS, a light signal is generated in the blood pressure monitor (BPM) and transmitted to the sensor, as shown in figure 4. The sensor is an interferometer, and its signal is sampled electronically at 1000 Hz. Discrete readings are obtained in millisecond intervals in increments of 0.1 mm Hg. Hence the MAP displayed on the BPM is an arithmetically averaged reading of 8000 BP observations obtained over 8 s. The small differences between MAP readings from the WB versus MAP readings from the PSS are largely due to the differences between the technologies, the summed artifacts, and the means of calculation.
Although our data did not include analysis of the SP versus the PSS, use of the SP for pressure monitoring may alter the primary functionality for which the SP is intended: flushing the sheath to prevent thrombus formation around inserted catheters. While some flushing may still occur via the drip that occurs through the WB line, adjustment and incrementation of that flush is restricted by the need to minimize flow through the WB because increased flow in the line to the WB transducer could inadvertently distort pressure readings. Also, potential thrombus formation around indwelling catheters occupying most of the sheath lumen represents an unquantifiable theoretical risk for further degradation of pressure function as the open sheath lumen is further compromised, and artifact may vary during a single procedure, owing to variations in degrees of thrombus formation. Further study to quantify this risk is warranted, especially given the anecdotal frequency of this practice. Tock and Hyman3 also studied the use of catheter introducers for pressure monitoring in a bench study and found distorted pressure measurements, even without the superimposed risk of thrombus formation.
For invasive BP monitoring, the standard approach in anesthesiology is use of a separate radial artery catheter. In cases where RAC is used, SP monitoring is obviated and the sheath size can be targeted solely to the size of the intended catheter. However, RAC carries infrequent but sometimes severe risks,4–9 including transient hand ischemia or even loss of the hand, and even when loss of the radial artery is asymptomatic due to collateral circulation, that loss is non-trivial in an era where radial arteries are used as primary access sites for interventions with increasing frequency.10
It is possible for two datasets to be strongly correlated but radically different. For instance, a data comparison between two groups with values (1,2, 3,…10) and (10,20, 30,…100) will be exactly correlated but very different. We used the percentage difference between means to evaluate whether the strong correlations could be inferred to indicate a degree of sameness between the datasets. Strong equivalence between mean values, combined with very strong correlations in the degrees of variability, corresponds to a high degree of sameness between datasets in the PSS versus RAC comparison, and a lesser degree of sameness (although still similar) in the PSS versus BP cuff comparison, which is supported by review of the individual data points compared in the tables. The further analysis using Bland–Altman techniques supports the ‘sameness’ of the measures, although differences in algorithms, calculation techniques for MAPs, known sources of error in the WB methodologies, and possible differences between radial and femoral artery pressure should be considered when interpreting data.
If this study were an attempt to compare patients with each other, the data would be flawed by differences in the numbers of sampling points per patient (varied from 3 to 13 in PSS vs BP cuff comparison and from 6 to 30 samples in PSS vs RAC comparison). However, the purpose of this evaluation was to compare measurement modalities, not to compare patients. Therefore, each observation was evaluated as a unique data point.
Significant ischemic injury occurs infrequently (<1%) with RAC, but can be disastrous when it does.9 ,11 A recent report by Rashid et al12 noted that the radial artery is an increasingly common conduit for cardiology procedures, and radial artery preservation is a desirable outcome. Rashid found an incidence of 5.5% radial artery occlusion (often without associated ischemic injury) 1 week after RAC for cardiology procedures, derived from a meta-analysis of 66 studies containing 31 345 participants. Rashid notes that “Transradial access (TRA) has grown to become the default access site in the UK, Europe, and Asia, and is rapidly growing in the USA. Compared with transfemoral access, TRA has been shown to reduce mortality and adverse cardiac events even in high risk patient groups, reduces major bleeding and access site related vascular complications and patient discomfort, and allows early mobilization and reduced procedure related costs”. Complications of TRA for BP monitoring may differ in incidence from TRA for interventional cardiology procedures owing to technical differences (catheter sizes, lengths, etc), but radial artery occlusion is a known complication of both indications for access, and even when clinically silent, loss of the radial artery compromises future options for that patient, as pointed out by Rashid.
RAC placement also consumes variable times which may be impactful in some cases, such as stroke13 ,14 or myocardial infarction.15 ‘Time is brain’ and ‘Time is muscle’ are well known marketing phrases from relevant professional societies.
The sensor in the PSS is robust, but some differences between WB and PSS measurements are to be expected, even when both function per specifications. Algorithms for pressures from analog measures may vary from monitor vendor to vendor. In the PSS, the BPM observes a 4 s window of readings and displays the peak pressure during that window as systolic and the trough pressure as diastolic. Since these are millisecond by millisecond observations, variations to the high side on systolic and to the low side on diastolic pressures may be observed versus the WB algorithms, and the software assumes a pulse rate of 15 or higher so that a full cardiac cycle will be contained in each 4 s window. The MAP displayed is the arithmetic mean of 8000 pressure measurements taken during the two preceding 4 s windows. The display refreshes every 4 s. Hence whereas pressures displayed on PCMs may be averaged over many seconds, the systolic and diastolic pressures are representing only the prior 4 s window and the MAP represents the immediately preceding 8 s. Hall16 defines MAP as “The average of the arterial pressures measured millisecond by millisecond over a period of time”. The PSS MAP is a true arithmetic mean, which closely matches the definition of MAP.
Caution was taken to ensure that the WB transducer was mounted at the appropriate height (mid-axillary line) on an IV pole for this study. However, misplacement of the transducer is a known source of error. As the actual measurement of pressure is the height above atmospheric pressure of the fluid column to the transducer, elevation or depression of the height of the transducer produces an equivalent depression or elevation of the measured pressure, and movement of the table up or down during a procedure or initial misplacement of the transducer above or below the level of the patient's aorta will produce that error. Air in the tubing connecting to the IV pole from the radial artery can also dampen the signal. The sensor in the PSS, however, is located in the patient's femoral artery and hence measures arterial pressure at its source.
The site of measurement should also be considered. While RAC is standard practice in anesthesiology, intensive care unit, etc, pulse contours from the femoral artery have been shown to more closely approximate that from the aorta.8 On the other hand, the radial artery approach in myocardial infarction has been shown to be associated with decreased mortality and decreased bleeding.10 Hence a case can be made that if available, the femoral artery is superior for BP monitoring and the radial artery is better to preserve for possible future intervention.
Positioning of the tip of the sheath in the lumen must be optimized during PSS placement. Signal dampening can be seen in tortuous or atherosclerotic arteries, or in the presence of spasm. As would be the case in any attempt to monitor pressure, the sensor must have unimpeded access to the femoral flow/pressure. Other potential sources of dampening could include aortic/iliac narrowing that decreases perfusion to the leg.
The four patients in whom the RAC was compared with the PSS had relatively homogeneous and normal BPs, and the extremes of clinical pressures were not tested. However, these observations would require large samples of critically ill patients to be validated clinically and were beyond the scope of this investigation.
Conclusions
The PSS offers robust digital arterial pressure monitoring at rapid sampling rates, available at the onset of femoral sheath placement. It avoids time delays and risks seen with separate RAC. Comparisons were obtained between MAP of dedicated RAC versus PSS monitoring in a population with pressures ranging from high to low normal, although extremes of pressure were not seen in this group. Pressures from the PSS are closely correlated and functionally equivalent (variability <4%, on average). Further analysis using Bland–Altman techniques suggests that PSS monitoring incorporated into the femoral sheath can substitute for separate RAC for invasive pressure monitoring at observed pressures. Significant correlations with pressure readings from a BP cuff were also seen but, as would be predicted, the BP cuff pressures trended lower and correlated less strongly versus radial artery comparisons. These factors should be considered (as well as sampling frequency, etc), in clinical decisions regarding pressure monitoring.
Footnotes
Contributors All co-authors contributed to the collection and/or analysis of the data reported herein. All co-authors received and reviewed the manuscript and were offered the opportunity to suggest changes, and consented via email to inclusion in the authorship of the manuscript. RPK, KCL, RLN, GLP, ASP, BA-K, and AR determined the comparison technologies to be used in their respective sites and reported data collected thereby. CS and ACE conducted the primary statistical analysis using the Bland–Altman technique and the Carstensen modification thereof. PDP performed the initial correlations, coordinated the statistical consultation, and prepared the manuscript for review by the co-authors.
Competing interests PDP is a co-founder of Endophys Holdings, LLC, and is the inventor of this device. He did not record any of the data analyzed herein, and the results and their interpretation were analyzed by independent statistical consultants, who are co-authors.
Provenance and peer review Not commissioned; externally peer reviewed.