Article Text

Abstract
Background Pulsatile tinnitus (PT) is a debilitating condition that can be caused by a vascular abnormality, such as an arterial or venous lesion. Although treatment of PT-related venous lesions has been shown to successfully cure patients of the associated ‘tormenting’ rhythmical sound, much controversy still exists regarding their role in the etiology of PT.
Methods A patient presented with a history of worsening, unilateral PT. A partial venous sinus obstruction related to the large arachnoid granulation was detected on the right side, and subsequently stented at the right transverse sinus. High-fidelity computational fluid dynamics (CFD) was performed on a 3D model digitally segmented from the pre-stent venogram, with assumed pulsatile flow rates. A post-stent CFD model was also constructed from this. Data-driven sonification was performed on the CFD velocity data, blinded to the patient’s self-reported sounds.
Results The patient reported that the PT was completely resolved after stenting, and has had no recurrence of the symptoms after more than 2 years. CFD simulation revealed highly disturbed, turbulent-like flow at the sigmoid sinus close to auditory structures, producing a sonified audio signal that reproduced the subjective sonance of the patient’s PT. No turbulence or sounds were evident at the stenosis, or anywhere in the post-stent model.
Conclusions For the first time, turbulence generated distal to a venous stenosis is shown to be a cause of PT. High-fidelity CFD may be useful for identifying patients with such ‘torrents’ of flow, to help guide treatment decision-making.
- blood flow
- intervention
- stenosis
- stent
- technology
Data availability statement
Data are available upon reasonable request.
This is an open access article distributed in accordance with the Creative Commons Attribution Non Commercial (CC BY-NC 4.0) license, which permits others to distribute, remix, adapt, build upon this work non-commercially, and license their derivative works on different terms, provided the original work is properly cited, appropriate credit is given, any changes made indicated, and the use is non-commercial. See: http://creativecommons.org/licenses/by-nc/4.0/.
Statistics from Altmetric.com
Introduction
Tinnitus is the perception of sound in the absence of an external source. It is a prevalent, often debilitating condition that can result in a significant psychological burden and, consequently, can have a significant impact on a patient’s quality of life.1–3 Pulsatile tinnitus (PT) is a rhythmical sound that is usually related to the patient’s heartbeat.1 PT can be related to non-structural causes (eg, hypertension, hyperthyroidism or anemia) or structural/anatomical causes.4 5 These structural causes can be non-vascular, such as bone erosions/dehiscence, pneumatization or even tumors of the temporal bone.6 The vascular causes of PT may include aneurysms, dissections, arteriovenous malformations or shunts7 and anatomical normal variations (such as the persistence of the stapedial artery).4
In addition, venous abnormalities can also cause vascular-related PT, and these include jugular bulb abnormalities8 or the presence of vestigial veins9 as well as developmental venous anomalies.10 In addition, in recent years there has been an increasing recognition of other venous sinus lesions and PT, including a strong association with intracranial idiopathic hypertension (IIH).11 These venous lesions may include venous sinus stenosis, thrombosis, diverticulum, dilatations, giant arachnoid granulations or extrinsic compressions of the sinuses.1 9
Despite reports of successful treatments of PT related to these venous lesions,11–13 much controversy still exists regarding the role of these vascular lesions (especially venous lesions) in the etiology of PT. We report the novel use of computational fluid dynamics (CFD) to demonstrate how a venous lesion can produce a PT. We used innovative advanced simulation techniques and a new computational sonification method to translate the hemodynamic parameters derived from the CFD analysis into a sound that accurately reproduced the sonance of the patient’s (subjective) PT.
Methods
The patient
A patient presented with a history of PT, with symptoms that persisted for 5 years and were worsening progressively. The patient described the tinnitus as a “whooshing sound” which repeated at the same frequency as her heartbeat (online supplemental audio 1). It was constant, unilateral (right-sided), worsened with physical exercise or with a head-down position, and it improved with ipsilateral jugular venous compression. There was no other relevant medical history. The patient reported that the PT had a significant negative impact on quality of life, affecting concentration, sleeping and mood, and as a result she was unable to perform many daily activities.
Supplemental material
When the patient was referred to us, she had already undergone both a CT venogram and a contrast-enhanced MR venogram (figure 1A,B). These showed bilateral large arachnoid granulations adjacent to the vein of Labbé, with significant resultant narrowing of the lumen of the transverse sinus. A diagnostic digital subtraction cerebral angiogram (DSA) and lumbar puncture with pressure measurements were performed to exclude other conditions such as IIH, dural arteriovenous shunts or other possible causes of her tinnitus. The lumbar puncture was performed with the patient in a left decubitus position, under local anesthesia, using fluoroscopy. The opening pressure was 13 cm H2O, and was deemed normal. As these tests were all negative, we diagnosed a partial venous sinus obstruction related to the large arachnoid granulation on the right side. From the cine DSAs we also diagnosed dominant venous drainage on the right side. We subsequently recommended stenting of the right transverse sinus. The patient consented, and we performed the procedure in November 2018. A 7×40 mm Wallstent (Boston Scientific, Marlborough, MA) was deployed across the stenotic segment of the sinus, without any need for post-stenting dilatation (figure 1D,E). The patient stated her PT was completely resolved as soon as she recovered from the general anesthesia. She was treated with clopidogrel and aspirin for 3 months and had no recurrence of the symptoms (at 29 months follow-up), and recent imaging demonstrated patency of the stent (figure 1).
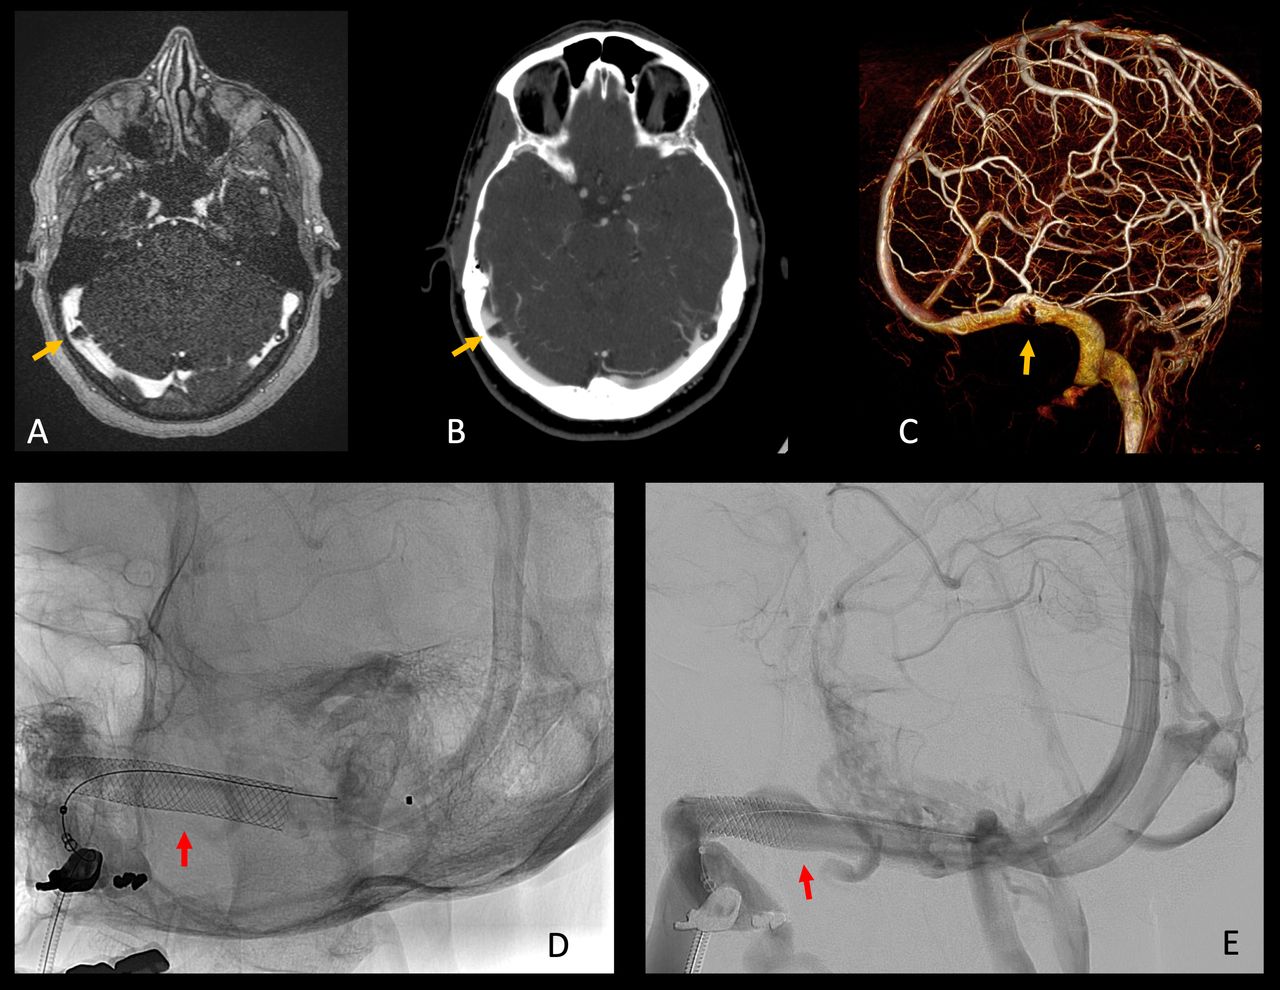
MR venography (A), CT venography (B), and venous phase 3D-RA surface (C) demonstrating severe stenosis (orange arrows) of the dominant right transverse sinus caused by an arachnoid granulation. Unsubtracted (D) and subtracted (E) post-treatment DSAs demonstrate patent stent (red arrows) in the right transverse sinus. 3D-RA, 3D rotational angiography; DSAs, digital subtraction cerebral angiograms.
Image acquisition and 3D-model preparation
During the endovascular procedure, a 3D-DSA was performed with a calculated delay (from 2D-DSA imaging) to capture the venous phase (figure 1C). Imaging was performed under general anesthesia. A calibrated flat-detector biplane DSA system (Allura Clarity, Philips Healthcare) was used for the acquisition of 3D volumetric images. DICOM images were exported using the Philips 3D Xtravision workstation.
3D-RA DICOM datasets were segmented using a previously described morphological gradient-based watershed analysis method and operator-defined topological cues, to produce a 3D surface model in stereolithography (STL) format. The STL file was then edited using an open source 3D sculpting-based computer assisted design program (MeshMixer, AutoDesk) to smooth the surface and remove artifacts. Lastly, the open-source Vascular Modelling ToolKit (VMTK) was used to perform surface re-meshing to improve surface triangulation. For the post-stent model, we edited the pre-stent segmentation, guided by the post-stent DSA, to “mimic” the post-stent geometry. Model geometries can be seen in figure 2.

Hemodynamics before versus after stenting. (A) Particle pathlines at peak systole, colored by velocity magnitude. (These are screenshots taken from the animations of the whole cardiac cycle, online supplemental videos 1 and 2, respectively.) Roman numerals identify the different flow regions discussed in the Results, and visually/aurally highlighted in online supplemental video 1. Note also the flow rate waveform inset into the left panel. (B) Spectral power index (SPI), where, for example, SPI=0.5 indicates that 50% of the fluctuating velocity power is associated with frequencies above 25 Hz.19 (C) Spectrograms based on velocity fluctuations within the region of high SPI before stenting (ie, IV-VI), indicating the presence of frequencies above 1 kHz.
Supplementary video
Supplementary video
Computational fluid dynamics
The segmented lumen surface inlet was clipped at the torcula, where a two-diameter cylindrical flow extension was added in order to impose fully-developed, pulsatile velocity profiles. The outlet was clipped at the jugular vein, where traction-free boundary conditions were assumed. VMTK was used to generate a volume mesh comprising 3.1 million tetrahedra, with edge-lengths of 0.2 mm around the stenosed region, gradually increasing to 0.3 mm upstream and downstream, and including four layers of progressively finer near-wall boundary elements.
In the absence of patient-specific inflow rates, we relied on published values. In particular, we digitized the jugular vein waveform shape from Stoquart-ElSankari et al,14 and smoothed it using a two-harmonic Fourier fit (pulsatility index=0.51). This was scaled to a cycle-averaged flow rate of 330 mL/min, roughly corresponding to the left/right average flow in the transverse sinus14 (see figure 2, inset of left panel).
Direct numerical simulation of the pulsatile flow was performed using the minimally-dissipative, second-order, open-source CFD solver Oasis.15 Numerical stability was achieved with 14 400 steps per cardiac cycle, corresponding to a temporal resolution of 0.064 ms given the 915 ms period of the flow rate waveform. Blood was assumed to be Newtonian, with viscosity and density of 0.0037 Pa-s and 1057 kg/m3, respectively, resulting in cycle-averaged/peak-systolic Reynolds numbers of 365/447 at the inlet and 2416/2951 at the stenosis.
Two cycles were simulated in order to dampen initial transients. Mesh and time-step sensitivity studies were performed to ensure that the presented results were qualitatively representative of the flow phenomena.
Sonification
Rather than attempt the computationally and conceptually challenging task of direct acoustic modeling,16 we chose instead to perceptualize the velocity data in auditory form, that is, sonification. This was done by converting the CFD velocity-time data into its time-varying frequency components via short-time Fourier transforms,17 that is, the spectrograms shown in figure 2. These were then recreated as sound using narrowly band-passed noise for each frequency bin of the spectrogram, controlling the loudness of each band with the amplitude of the corresponding frequency bin through time.18 The sonification was generated objectively, blinded to the patient’s self-reported description of her PT.
Results
Following stenting, the patient reported immediate cessation of her pulsatile tinnitus and no recurrence was reported over the course of a 2 year follow-up. Using the pre-stent and post-stent 3D models created, based on the 3D-DSA and imaging obtained during the procedure, CFD simulations were performed on both geometries to assess the hemodynamics in the venous system before and after treatment. As evident in figure 2, and more so in the animated flow visualization (online supplemental video 1), the large arachnoid granulation in the pre-stent geometry perturbed the smooth, laminar inflow in the transverse sinus (region I) into high-speed jetting (region II), which breaks down into transient, turbulent-like flow that persists to the level of the sigmoid sinus (regions V and VI). This translated to high levels of spectral power index (SPI), a recently-introduced metric of high-frequency velocity fluctuations indicating turbulent-like flow,19 seen in figure 2. The anatomical relationships between these locations of high-frequency velocity fluctuations and the inner ear structures are demonstrated in figure 3. A small persistent vortex was present just distal and inferior to the stenosis jet (region III); however, SPI in this region was low, indicating laminar flow. Similarly, SPI was negligible entering the jugular vein (region VII), where flow has relaminarized, although with strong helicity induced by the proximal sigmoid bends.
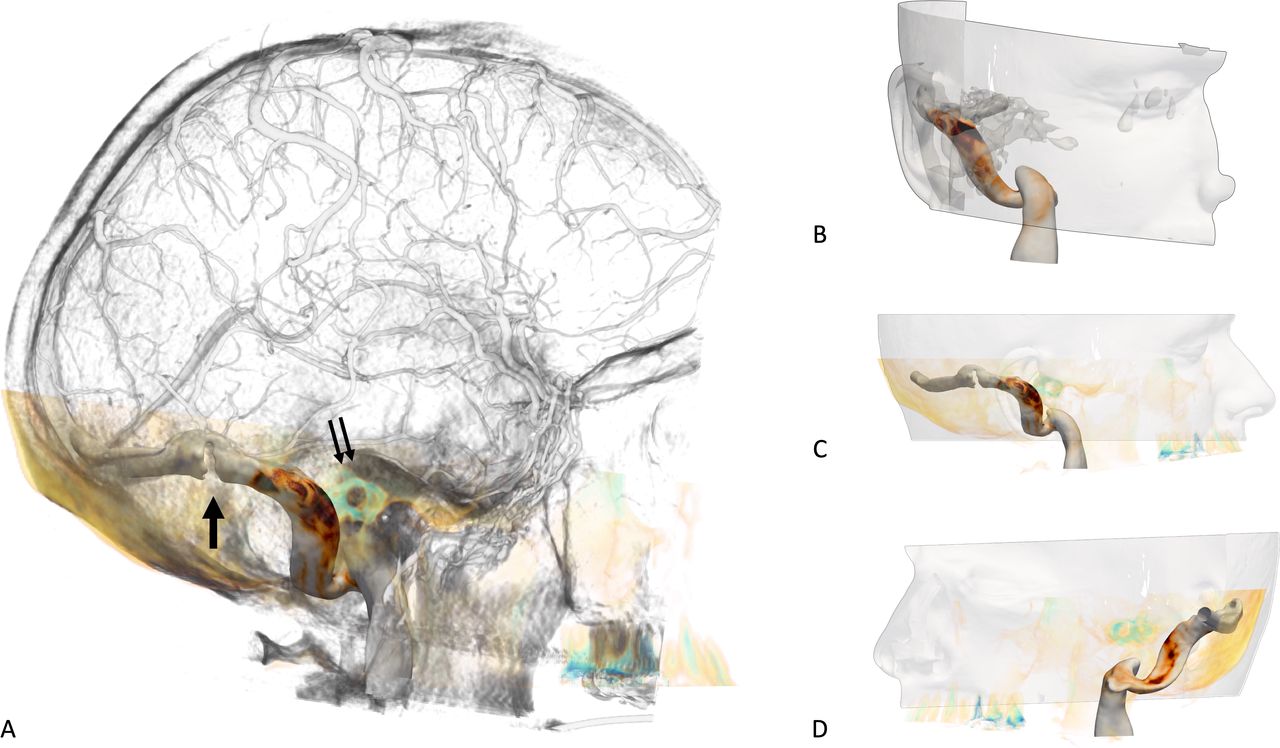
Spatial relationship between right transverse sinus stenosis, subsequent high frequency velocity fluctuations (SPI map from Figure 2B) and the inner ear structures within the temporal bone. (A) Lateral view showing segmented 3D venous cerebrovascular anatomy from CT venography merged with a 3D-RA of veins, merged and geometrical model with stenosis (black arrow) and SPI embedded within the skull (yellow); inner ear structures (double black arrow) are highlighted within the temporal bone (light blue). (B) Right venous sinus SPI model embedded within the temporal bone. Simplified figures of panel A demonstrating relationship between SPI and inner ear structures in right lateral (C) and left lateral (D) views. 3D-RA, 3D rotational angiography; SPI, spectral power index.
As seen in figure 2, spectral analysis of velocity data from the region of high SPI revealed energetic, broadband frequency components up to ~1 kHz at peak systole, persisting throughout much of the cardiac cycle, although with varying intensity and frequency content. Horizontal striations at around 200 Hz and its multiples suggest the presence of narrowband harmonic (laminar vortex shedding) flow phenomena as well. (The supplementary animation shows that these harmonic structures are confined primarily to jet instability in region IV, whereas the more broadband, turbulent-like flow is evident at regions V and VI.) The resulting sonifications of the spectral data (incorporated into online supplemental file 1) manifested as a kind of ‘whooshing’ sound that modulated with the flow rate over the cardiac cycle, but only in those regions with unstable or turbulent-like flow (ie, high SPI), and with distinct sonic character from region to region.
As shown also in the right-side panels of figure 2 (and animated in online supplemental file 2), dilation of the stenosis (mimicking stent placement) eliminated any flow instabilities, resulting in a smooth, laminar, swirling flow in the tortuous venous geometry, without any SPI or evident spectral (and hence sonic) features.
Discussion
Our study used a novel method of high-fidelity CFD-derived sonification to assess the mechanism of PT related to a venous sinus obstruction. We demonstrated that the giant arachnoid granulation resulted in narrowing of the sinus lumen, causing turbulent-like flow that caused the PT, possibly as a result of resonance through the temporal bone to the auditory structures. We also demonstrated that the flow in the sinus became laminar after treatment with the stent. Furthermore, when sonification was applied to the post-stenting CFD study, no sound pattern could be generated. While CFD has been sporadically applied to the intracranial venous system before, this is the first time that CFD was used to successfully elucidate the mechanism of a PT related to venous sinus stenosis. When we played the audio file generated from the CFD study for the patient, she stated that the sound was similar (and distressingly so) to her symptomatic tinnitus.
PT can be caused by a multitude of vascular conditions20; however, most attention has focused on the arterial causes, while venous diseases may be more common than previously thought, and may be under-diagnosed (and potentially treatable) causes of PT.21 22 Some venous lesions may be related to sigmoid sinus wall dehiscence (SSWD) while others, like the case we describe, occur secondary to venous obstruction resulting in altered hemodynamics.23 At present, there is a lack of validated non-invasive imaging methods to assess hemodynamics in PT patients. CFD is a non-invasive post-processing method using images acquired during the routine workup that could help illuminate further the pathophysiology of this potentially debilitating disorder. For example, a recent study used CFD to evaluate the mechanisms of PT in patients with venous sinus anomalies. They used low-fidelity CFD (relatively coarse meshes and time-stepping, and possibly dissipative solver numerics24), so they could not assess high frequency fluctuations or turbulence; however, they did find significant hemodynamic changes in the venous sinus on the side of the PT.22 The same group also evaluated the results of a resurfacing surgery on patients with PT related to SSWD.25 They found that high-pressure zones corresponded to the dehiscent areas and that despite the resurfacing, some patients had persistent PT with qualitative abnormal flow.
Can hemodynamic changes in the venous sinus be related to PT?
One study measured the venous sinus pressure and velocities in patients with IIH undergoing stenting and demonstrated that the velocities are accelerated at the level of the stenosis and they normalize once the stent is placed.26 Another study used 4D-flow MRI to study flow in patients with PT.27 They reported that PT patients preferentially had “vortical or turbulent flow” in the venous sinus when compared with normal controls. One may question, however, whether this is true “turbulence” because MRI does not have the temporal resolution necessary to capture this. The authors defined turbulence as “disorderly distributed streamlines and discontinuous velocity vectors”, which is different from our definition of high-frequency flow instabilities, a definition that is consistent with classic fluid dynamics. Another study using CFD and patient-specific boundary conditions from 4D-flow MRI demonstrated that the abnormal flow changes propagate through the venous system, distal to the stenosis segment and even as far distal as the jugular bulb.28 This is demonstrated in our study as well, but with actual high-frequency flow instabilities as opposed to “abnormal flow” in their study. That study used 1M element mesh and Fluent for CFD, with no mention of whether they used high-order stabilization. So, without high-fidelity CFD, one cannot report high-frequency flow instabilities, but rather just infer the possibility from complex streamlines. Those authors speculated that “vortical flow may also produce audible sound”; however, our supplementary animation clearly demonstrates that vortical flow alone (eg, regions III or VII) is not sufficient to produce PT. Similarly, immediately downstream of the stenosis the inertia of the jet keeps it coherent for some distance (eg, region II), and thus produces no sound. Our simulation demonstrated that the sites of highest SPI/turbulence in the transverse/sigmoid sinus (several diameters distal to the stenosis where the jet instabilities have completely broken down, but before the turbulence has dissipated) are in proximity to auditory structures (figure 3), which is consistent with the patient’s subjective symptoms.
Regarding the flow changes after stent placement, a study reported a significant improvement in flow direction and magnitude.29 Our study also demonstrates that the stenting procedure and the resolution of the venous obstruction resulted in amelioration of the hemodynamic changes by eliminating the high-frequency, turbulent-like flow fluctuations that were the origin of the PT. This was further quantified in our sonification tool, and it is reassuring that not only did these changes resolve following the stenting, but this correlated with an immediate and complete resolution of the patient’s symptoms.
Can CFD be reliable for the assessment of the venous system in PT patients?
Another study analyzed 4D-MRA and CFD in patients with sigmoid sinus diverticulum (SSD) and PT.30 They demonstrated that both methods were able to demonstrate complex flow patterns in SSD patients. Patients with PT were more likely to have strong rotational flow components compared with controls. That group also reported in one patient that the vortex flow in the sigmoid sinus resolved after surgical removal of the diverticulum. It is conceivable that turbulent flow downstream of the stenosis, within the SSD or at the outlet of the SSD, may contribute to sound generation. Our study actually demonstrates that this, and not vortex flow, is the likely cause of PT.
In many instances, PT can be caused by multiple factors and the venous stenosis may be an imaging finding unrelated to the noise production.1 The prevalence of unilateral dural sinus stenosis in the general population may be as high as 33% and in many cases it therefore may not be related to PT.31 Therefore hemodynamic assessment using high-fidelity CFD and sonification may aid in diagnosis and support the management of PT patients, but it must of course be tied into the broader clinical picture. Further studies are necessary to validate our results and expand our knowledge regarding the hemodynamics of the venous system related to PT. We can then begin to develop reliable non-invasive biomarkers for this condition.
Limitations
This study has several limitations. The presence of the granulation required manual editing and smoothing in order to get a satisfactory segmentation of the stenotic region, and the post-stent geometry was generated virtually from the pre-stent one. Several assumptions were made for CFD analysis, including Newtonian rheology with assumed blood viscosity, and rigid vessel walls. As noted in the Methods, flow rates were not patient-specific, and we assumed the same inflow rates for both pre- and post-stenting. Nevertheless, such limitations are present in previous CFD studies of PT, whereas here our goal was to emphasize the importance of high-fidelity CFD to resolve high-frequency flow instabilities as a plausible source of PT sounds.
Conclusions
We report the novel use of CFD to demonstrate how high frequency velocity fluctuations produced near the inner ear structures by a venous lesion can manifest as pulsatile tinnitus. We were able to accurately reproduce the sonance of the patient’s subjectively reported PT using innovative advanced hemodynamic simulation techniques and a new computational sonification method.
Data availability statement
Data are available upon reasonable request.
Ethics statements
Acknowledgments
We would like to thank the Michaels family for their generous support to our RADIS laboratory's computer cluster (Twitter: @RADIS_lab).
References
Supplementary materials
Supplementary Data
This web only file has been produced by the BMJ Publishing Group from an electronic file supplied by the author(s) and has not been edited for content.
Footnotes
Twitter @biomedsimlab
NMC and MN contributed equally.
Contributors VMP, NMC, MN and DAS contributed to the design of the study. All authors contributed to the acquisition and/or analysis of the data, and the drafting and/or editing of the manuscript. All authors approved the final manuscript.
Funding DAS acknowledges the support of a grant from the Natural Sciences and Engineering Research Council of Canada (RGPIN-2018-04649). Computations were performed on the Niagara supercomputer at the SciNet HPC Consortium. SciNet is funded by: the Canada Foundation for Innovation; the Government of Ontario; Ontario Research Fund - Research Excellence; and the University of Toronto.
Competing interests None declared.
Provenance and peer review Not commissioned; externally peer reviewed.
Supplemental material This content has been supplied by the author(s). It has not been vetted by BMJ Publishing Group Limited (BMJ) and may not have been peer-reviewed. Any opinions or recommendations discussed are solely those of the author(s) and are not endorsed by BMJ. BMJ disclaims all liability and responsibility arising from any reliance placed on the content. Where the content includes any translated material, BMJ does not warrant the accuracy and reliability of the translations (including but not limited to local regulations, clinical guidelines, terminology, drug names and drug dosages), and is not responsible for any error and/or omissions arising from translation and adaptation or otherwise.