Article Text

Abstract
Background Pre-intervention perfusion imaging is increasingly becoming part of stroke triage. Small studies supporting imaging based patient selection have been published. The goal of this larger study was to determine if perfusion imaging could impact on functional outcomes in patients undergoing stroke interventions.
Methods All patients who had undergone endovascular therapy for anterior circulation strokes over a 7 year period were retrospectively analyzed. The pre-intervention perfusion imaging was assessed for size of cerebral blood volume (CBV), cerebral blood flow and mean transit time (MTT) abnormalities. A perfusion mismatch for irreversible versus reversible ischemia was based on CBV and MTT. Clinical outcome and mortality were based on the 90 day modified Rankin Scale. An analysis of the pre-intervention perfusion parameters was then performed to determine any impact on functional outcomes.
Results 110 patients underwent endovascular therapy for anterior circulation strokes. A younger age and lower National Institutes of Health Stroke Scale score were important clinical predictors of favorable outcome (modified Rankin Scale ≤2). The extent of the CBV abnormality and percentage of CBV/MTT mismatch were the strongest imaging predictors of outcome and mortality. A CBV area of 229.5 mm2 (±290) was seen for favorable outcomes versus 968 mm2 (±1173) for poor outcomes (p<0.0001). A CBV/MTT mismatch of 91% (±10.7) was seen for favorable outcomes versus 72.5% (±31.6) for poor outcomes (p=0.0001). The CBV area was 273 mm2 (±392) in patients without mortality versus 1401.1 mm2 (±1310) in patients with mortality (p<0.0001). Patients who survived had a mean CBV/MTT mismatch of 90.2% (±12.5) versus 61.1% (±35.2) for those who did not (p<0.0001). A CBV lesion approximately greater than one-third of the middle cerebral artery distribution predicted a poor outcome and mortality.
Conclusion The extent of pre-intervention CBV abnormality is a strong predictor of functional outcomes following endovascular stroke therapy. This information can aid in patient selection and improve procedure efficacy.
Statistics from Altmetric.com
Introduction
The endovascular treatment of acute ischemic stroke is gravitating toward the use of mechanical devices for vessel recanalization. The approval of previous thrombectomy devices for clot removal1–3 has spurned development of the next generation of such devices4–6 with a goal of achieving higher recanalization rates. While the focus on revascularization is understandable, there has been little consensus on appropriate triage of patients who undergo these invasive procedures. Despite recent evidence in the literature on the role of pre-intervention perfusion imaging in stroke triage,7–9 there is no large study demonstrating an impact of perfusion imaging on functional outcomes in stroke patients. For a triage strategy that incorporates physiologic imaging to be relevant, it has to demonstrate an impact on procedure outcomes in terms of clinical recovery. While immediate procedure success can be based on a recanalized blood vessel, the effectiveness of that recanalization can only be determined by neurological improvement. The current paper offers an analysis of pre-intervention perfusion imaging with a goal to determine any association between these parameters and patients' functional outcomes.
Methods
Patient selection
Institutional review board approval was obtained for this retrospective analysis of our prospectively managed database for endovascular stroke therapy. All patients who had treatment for anterior circulation strokes over a 7 year period formed the cohort for this analysis. Baseline patient demographics, including age, gender, National Institutes of Health Stroke Scale (NIHSS) score, time to presentation from symptom onset as well as the 90 day (or closest follow-up), were recorded. Additionally, the site of vessel occlusion, vessel recanalization and the use of general endotracheal anesthesia (GETA) were included. All patients had also undergone pre-intervention functional imaging as described next.
Imaging protocol
At our tertiary referral hospital all patients presenting with acute ischemic stroke undergo pre-intervention imaging with a ‘stroke CT’; exceptions include patients with renal insufficiency or documented significant contrast allergy, in which case an MRI may be performed. The ‘Stroke protocol’ examination comprises a non-contrast CT (NCCT), a CT perfusion (CTP) study and a CT angiogram (CTA). The CTP is performed at two levels with low dose settings. The first scan is set at the level of the basal ganglia to cover the anterior circulation and the second scan is set more inferiorly to also include the posterior circulation. A total of four slices are obtained per scan with a slice thickness of 0.8 mm yielding a total coverage of 32 mm for each level (64 mm total). A total of 40 ml of contrast, Optiray 350 (Covidien, Hazelwood, Missouri, USA), followed by 20 ml of saline flush are injected through an 18 or 20 G antecubital intravenous line at a rate of 4–5 ml/s. The perfusion scan is started with a 7 s delay from the start of the contrast injection and the scan is carried for 60 s to obtain a complete tissue time–density curve. The perfusion parameters generated include cerebral blood flow (CBF), cerebral blood volume (CBV), mean transit time (MTT) and time to peak. The CTA is then performed from the aortic arch to the cranial vertex with 70 ml of intravenous Optiray 350 with 0.5 mm acquisition reconstructed at 1 mm slice thickness and 1 mm intervals. Thus a total of 150 ml of contrast are administered for the study. The neuroradiologist performing the intervention reviews the images. Patients with obvious NCCT findings of acute infarction are not included. Additionally, while strict inclusion or exclusion criteria based on imaging are not consistently applied, generally the patients selected for therapy have a clear vascular occlusion on the CTA, have a small CBV abnormality and large mismatch between CBV and MTT. Lastly, while perfusion parameters certainly play a role in our patient selection, any ambiguity favors treatment. Also, young patients and those presenting very early may be included in spite of the imaging findings.
Image analysis
The source images acquired for the initial perfusion study were processed utilizing Vitrea-4 perfusion software by Vital Images (Minnetonka, Minnetonka) (figure 1). The software uses a deconvolution method based on singular value decomposition. For this study, we chose to process the images without delay correction, as this was the methodology used in the actual clinical setting. A neuroradiologist blinded to the procedure outcome evaluated the re-processed images. The perfusion parameters analyzed included MTT, CBF and CBV. The perceived perfusion abnormality was outlined manually by a region of interest (ROI) yielding an area (mm2) for two consecutive slices showing the largest abnormality; an average of the two levels was then recorded. The software automatically generates a contralateral mirror image ROI. An absolute value for the perfusion parameter under evaluation for both the affected (abnormal) and unaffected ‘normal’ ROIs was recorded. A relative value for the parameter was then obtained as a percentage of the affected to the unaffected ROI (figure 1) to reflect the difference between the two sides, thus indicating the percentage difference at which the abnormality was perceived. A perfusion mismatch percentage was then calculated based on the size of the MTT and CBV abnormalities and defined as (1−CBV/MTT) × 100.

Image analysis. The images show mean transit time (MTT) and cerebral blood volume (CBV) maps from a patient with right middle cerebral artery (MCA) occlusion. The region of abnormal MTT and CBV is outlined in black with corresponding mirror image regions of interest (ROI) in the left hemisphere. The ROIs for both MTT and CBV are listed as mm2. The CBV/MTT mismatch using (1−CBV/MTT) ×100 is calculated at 92.2%. The difference between the absolute values in the normal and abnormal hemispheres show that the MTT in the abnormal right MCA distribution is 185% of the left side and CBV in the right ROI is 38.7% of the left ROI.
The site of vascular occlusion was analyzed based on the CTA as well as the angiogram and divided into intracranial internal carotid artery (ICA) with or without extension into any of the terminal branches (ICA), middle cerebral artery (MCA) occlusion either at the main stem or the bifurcation with or without thrombus extending into the proximal M2 branches (MCA) or isolated M2 or M3 branch occlusion (M2/M3).
The endovascular procedure
All endovascular procedures were performed through a transfemoral arterial access. The procedures were performed with either GETA (n=63) or conscious sedation (n=47) administered by the anesthesia team. The type of endovascular treatment included intra-arterial thrombolytic administration only (n=43), mechanical thrombectomy only (n=24) or a combination of both (n=43). All patients recovered in the intensive care unit following the procedure.
The procedure success was based on the Thrombolysis in Myocardial Ischemia score evaluated by an operator blinded to the clinical information and the outcomes. Successful recanalization was defined as a Thrombolysis in Myocardial Ischemia score of 2 or 3. Clinical outcome was based on the 90 day modified Rankin Scale (mRS) with a mRS score ≤2 indicating a favorable outcome.
Statistical analysis
The significance of simple bivariate associations was assessed using χ2 tests or logistic regression, as appropriate. Comparison of continuous variables was made using paired t tests. Multiple logistic regression was used when several factors were assessed simultaneously. We performed a recursive partition or decision tree analysis to generate a predictive model for functional outcome and mortality based on multiple variables. Decision tree analysis was done using a binary splitting algorithm that searches all possible ways to divide the responses into relatively homogeneous groups. The criterion for the best split at each step is the one that maximizes significance according to logworth statistics. The algorithm is similar to the Classification and regression tree methodology, as described previously.10 All data analysis was performed using JMP statistical software, V.9 (SAS Institute Inc).
Results
Summary
A total of 110 patients were included in the analysis. Median age was 72.5 years (IQR 58–82.5). Gender was evenly distributed, with 50% female patients. The median NIHSS at presentation was 16 (IQR 10–20). Mean time to procedure was 6 h (±3.2 h) and mean procedure duration was 1 h 12 min (±38 min). Successful recanalization was seen in 62 (56.4%) patients. A good outcome (mRS ≤2) was seen in 50 (45.5%) patients while mortality was observed in 35 (31.8%) patients.
Clinical predictors of outcome
The pre-procedure clinical factors impacting on outcome included a lower NIHSS score at presentation (mean 13 (±6.5) for those with a favorable outcome versus 18.2 (±7.4) for those with a poor outcome (p=0.0001)) and a lower age (mean 62.8 (±18.6) years for a favorable outcome versus 73.5 (13.4) years for a poor outcome (p=0.0007)). Likewise, both age and NIHSS score had an impact on mortality; a mean NIHSS of 19.6 (±7.3) in patients who died versus 14 (±6.9) in those who did not (p=0.0002) and a mean age of 75.3 (±11.5) years in the mortality versus 65.5 (±17.9) years in the no mortality group (p=0.004).
NIHSS score, successful recanalization, outcome, mortality and the pre-procedure perfusion data significantly varied with the site of occlusion (table 1). The worst outcome and mortality were seen in the ICA group, which also had the least recanalization and the highest NIHSS scores (table 1). The area of the perfusion abnormality in the affected hemisphere for all parameters correlated significantly with the site of occlusion (table 1) and was largest for proximal occlusions.
Baseline NIHSS, procedure success, functional outcome and perfusion parameters presented by site of occlusion
Analysis of perfusion parameters
The baseline distribution of the pre-intervention perfusion parameters is shown in figure 2. The distribution of CBV is skewed toward areas of small CBV lesions while the percentage of mismatch is skewed toward a distribution of higher mismatch or penumbra. The absolute values in the unaffected and affected hemispheres are given in table 2. These show a significant difference between the abnormal and normal hemispheres. The relative values show a mean drop of at least 46% between the abnormal and normal ROIs to detect a decreased CBF (p<0.0001), a drop of 54% to detect a decreased CBV (p<0.0001) and an increase of 223% to detect a prolonged MTT abnormality (p<0.0001).
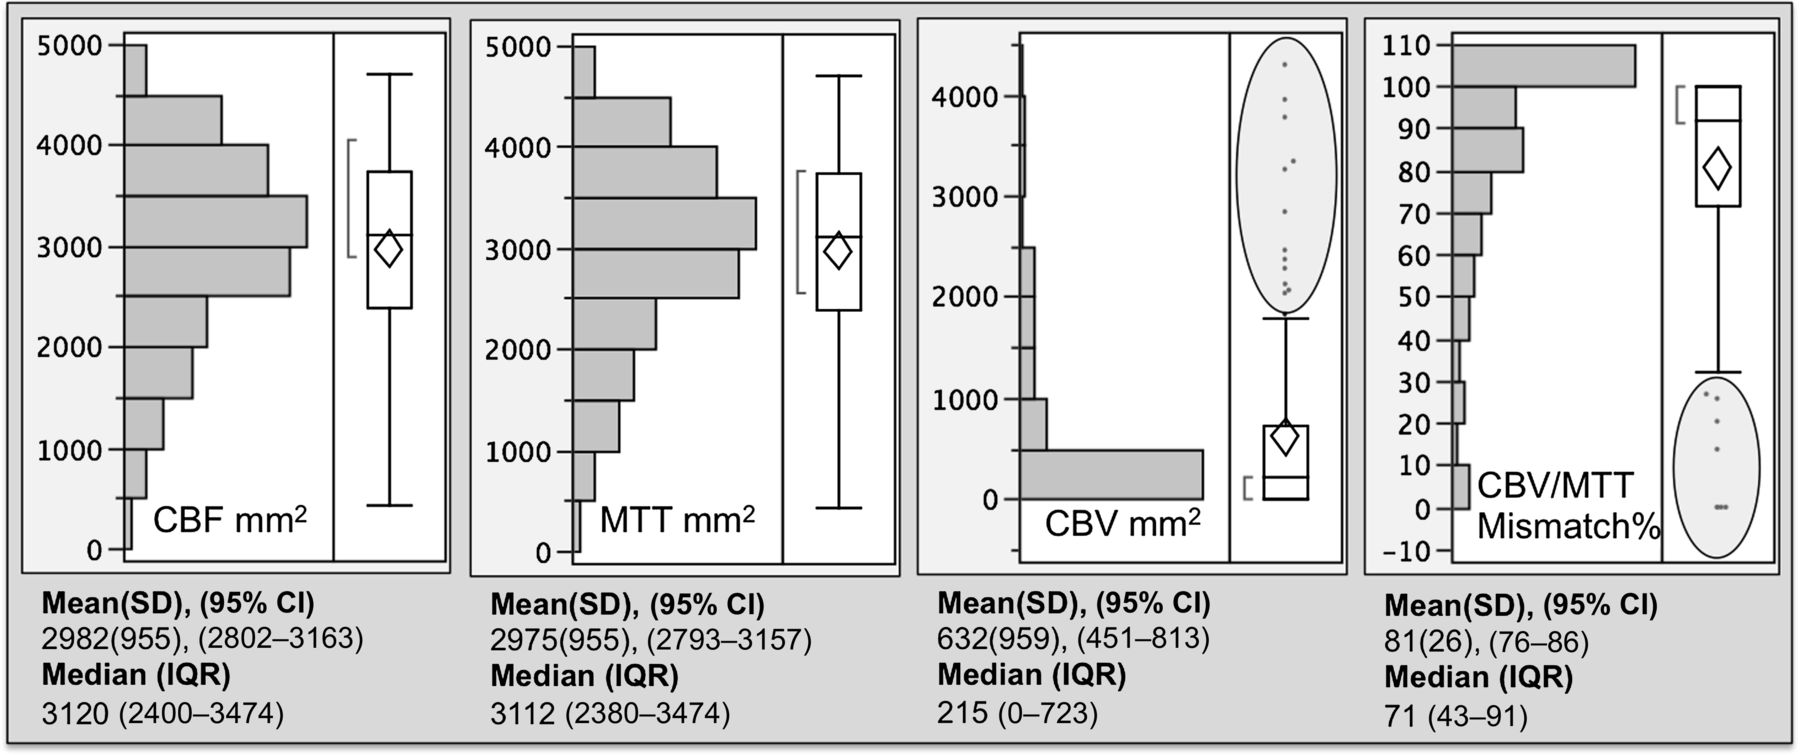
Baseline perfusion parameters. A spread of the lesion size for pre-intervention perfusion parameters is shown. CBF, cerebral blood flow; CBV, cerebral blood volume; MTT, mean transit time.
Mean values for the unaffected (normal) and affected (abnormal) regions of interest for each parameter
The impact of baseline perfusion parameters on outcome and mortality is shown in table 3. Smaller lesions on all parameters and a high CBV/MTT mismatch percentage were associated with a favorable outcome while larger lesions and low mismatch were associated with mortality (table 3). A small CBV abnormality was the most significant predictor of a good outcome (p<0.0001) and a large CBV abnormality was the most significant predictor of mortality (p<0.0001).
Impact of different perfusion parameters on outcome and mortality
Recanalization and perfusion
We separated patients into recanalized and non-recanalized subgroups and analyzed the impact of perfusion imaging on outcome in these subgroups. In both the recanalized and non-recanalized cohorts, neither CBF nor MTT impacted on outcome. In non-recanalized patients, a smaller CBV lesion (p=0.03) and a higher CBV/MTT mismatch (p=0.03) were associated with a good outcome. This association however was much stronger in the recanalized cohort where a small CBV size (p=0.0003) and a large CBV/MTT mismatch (p=0.001) significantly predicted a good outcome.
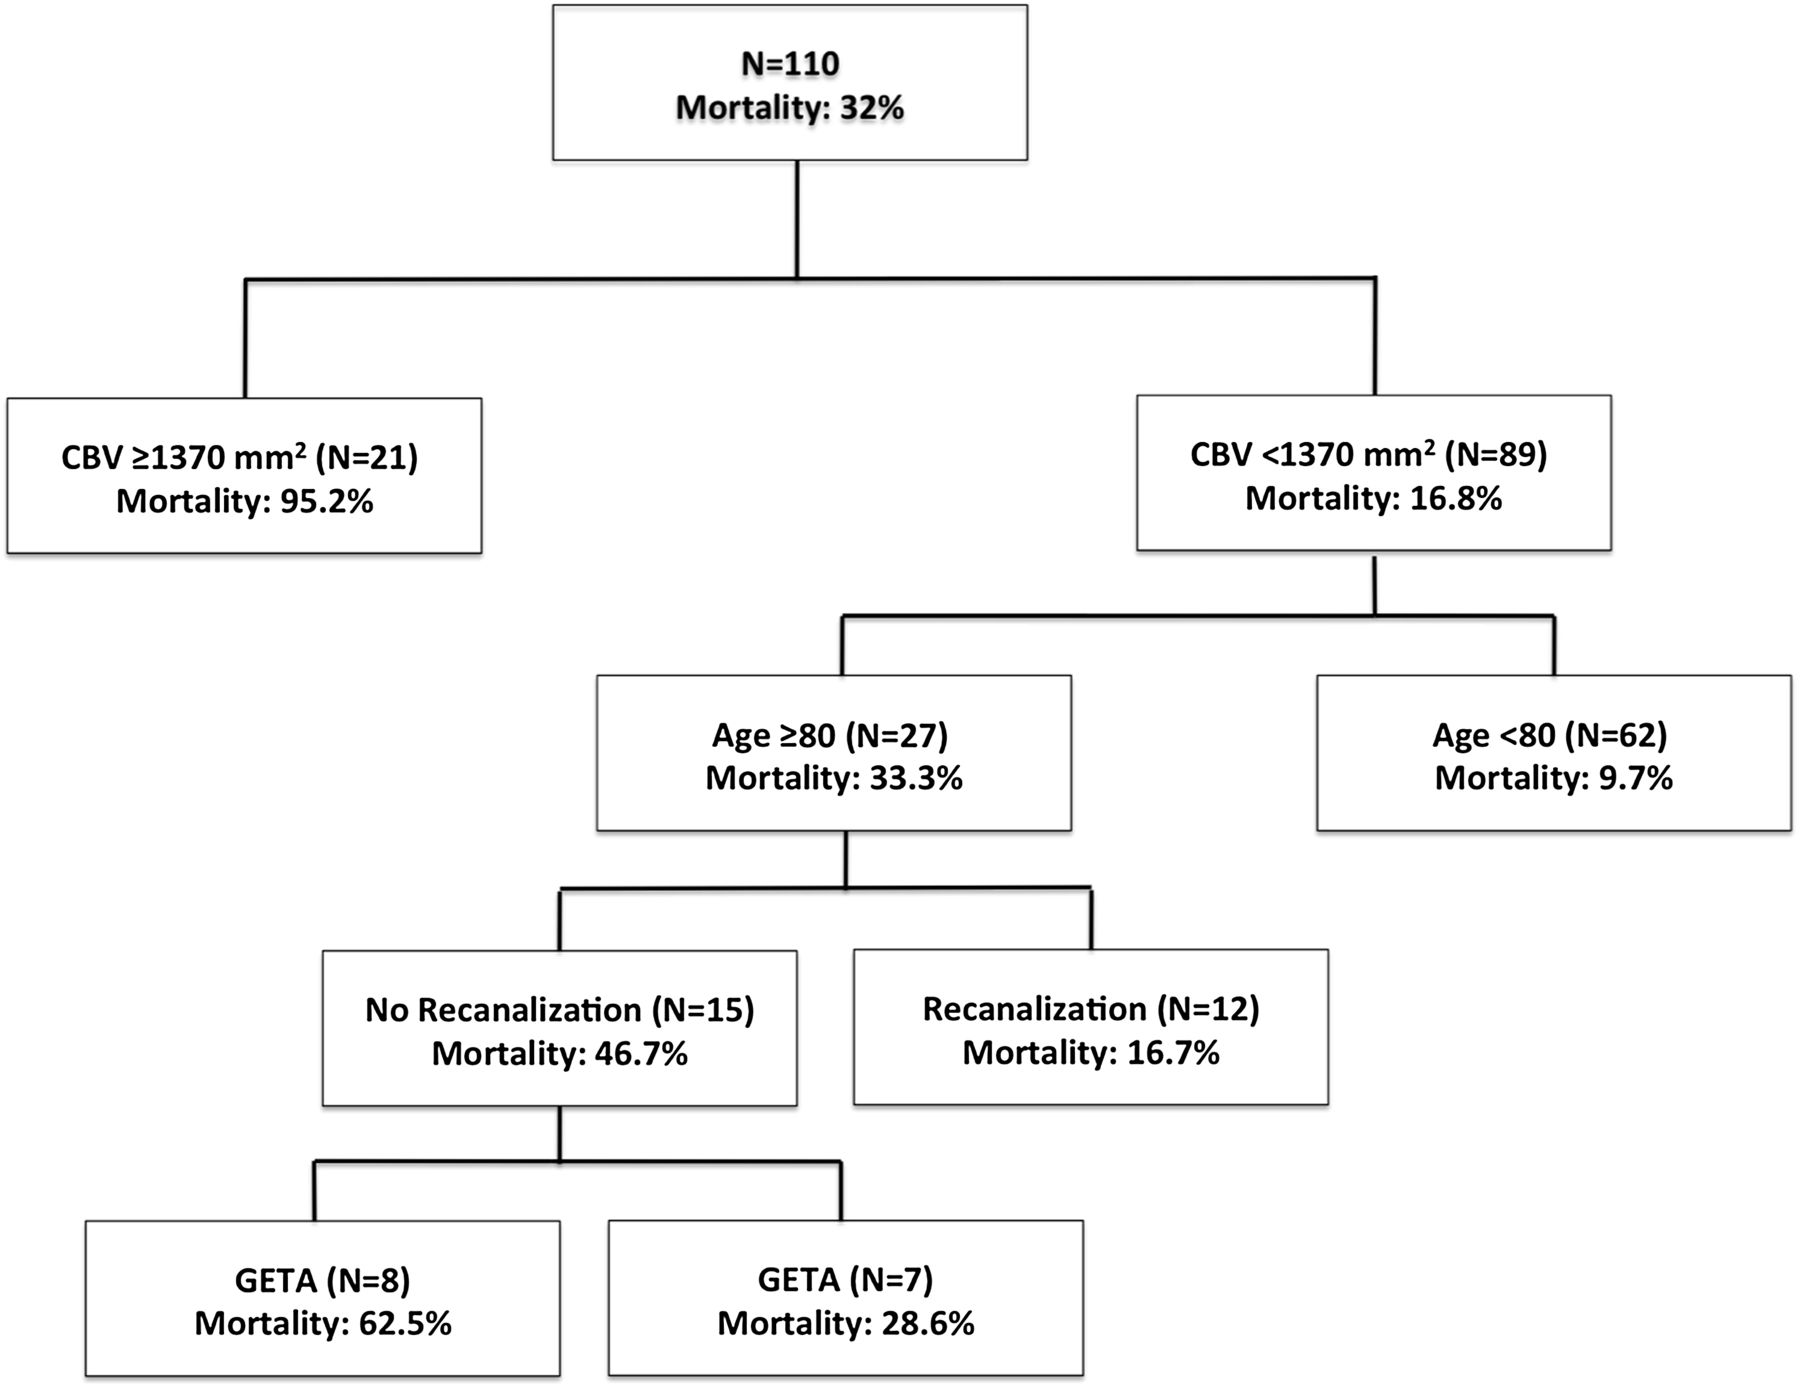
To better understand the relationship of the different clinical and imaging predictors of outcome, we performed a recursive partition analysis for outcome and mortality based on age, baseline NIHSS, CBV, MTT and CBF lesion size, CBV/MTT mismatch, site of occlusion, success of recanalization and use of GETA. The outcome analysis (figure 3) showed that recanalization was the first break point in predicting outcome; this was followed by CBV lesion size. Patients with a CBV >1370 mm2 did not achieve a favorable outcome despite recanalization. In patients with a CBV lesion less than 1370 mm2, NIHSS score was the next predictor followed by age. In non-recanalized patient, patients with an ICA occlusion universally had a bad outcome and even those with more distal occlusions had a good outcome of only 18.8%. Mortality analysis (figure 4) showed that CBV lesion was the main predictor of mortality; patients with a CBV lesion >1370 mm2 had a mortality of 95%. In patients with a CBV lesion <1370 mm2, age over 80 years followed by unsuccessful recanalization and GETA predicted a higher mortality than age below 80 years, successful recanalization and no general anesthesia. The largest CBV abnormality in the MCA distribution (involving the entire MCA territory) measured 3775 mm2. A CBV abnormality of 1370 mm2 that emerged in the recursive partitioning as a break point thus corresponds to a little over one-third of the MCA territory.

Recursive partition analysis for outcome. All perfusion parameters, including CBV/mean transit time mismatch as well as age, National Institutes of Health Stroke Scale (NIHSS) score, vessel occlusion site and recanalization were included in the algorithm to perform a multivariable analysis predicting functional outcome at each breakpoint. CBF, cerebral blood flow; CBV, cerebral blood volume; ICA, internal carotid artery; MCA, middle cerebral artery.

Recursive partition analysis for mortality. All perfusion parameters, including CBV/mean transit time mismatch, as well as age, National Institutes of Health Stroke Scale (NIHSS) score, vessel occlusion site, recanalization and general endotracheal anesthesia (GETA) were included in the algorithm to perform a multivariable analysis predicting mortality at each breakpoint. CBV, cerebral blood volume.
Discussion
Utilization of functional imaging in the triage of patients undergoing endovascular stroke therapy is increasingly becoming a part of the stroke workup. Both MRI and CT are used for this purpose. While MRI has distinct advantages in identifying infarcted tissue, logistics surrounding round the clock availability and higher cost may limit its impact as a screening tool in a highly time sensitive disease process such as acute ischemic stroke. A significant body of literature supports the fact that CTP imaging parallels the predictive benefits of MR in determining irreversible ischemic injury.11–14 While the two techniques, diffusion weighted imaging and CTP, are targeting different pathophysiologic mechanisms (cytotoxic cellular injury versus microcirculatory failure), the ultimate goal of imaging is in improving the effectiveness of an endovascular intervention as measured by functional outcomes. Such effectiveness may also be measured in terms of reducing the rates of futile recanalization15 ,16—that is, revascularization without clinical recovery.
The clinical predictors of outcome in stroke patients are well documented in numerous intravenous17 and endovascular studies1–3 ,18 ,19 but perfusion imaging as a predictor of outcome is less well studied. One reason could be the lack of a standardized imaging approach. Variation in the imaging technique as well as vendor software highlights this limitation.20 ,21 Second, imaging represents a snapshot in time in an otherwise complicated and rapidly evolving process. An endovascular intervention may not be performed for an hour or more after imaging and revascularization may not be achieved until even later. The further out the intervention from imaging, the less relevant the information obtained from it, since time will trump collaterals or any cerebral regulatory response to vascular occlusion. Third, different variables such as occlusion site and recanalization impact procedure outcomes in endovascular therapy and there are few data that have integrated imaging with these variables in developing a confident imaging inclusive triage strategy. Thus, unfortunately, an understanding of perfusion imaging at a cellular or pathophysiologic level has not achieved relevance in the broader clinical context of endovascular stroke therapy. The discrepancy between the microenvironment and the patient setting has fueled debates regarding ‘ischemic core’ and ‘penumbra’. Histologically, true infarct core secondary to vascular occlusion can only reliably be determined if means exist to immediately reverse the occlusion—in other words, the impact of time on injury is neutralized. In reality, however, the severity and duration of injury are both relevant and analysis of pre-perfusion imaging regarding its applicability to stroke intervention should take into account the inherent delays between imaging and intervention.
The distribution of the CBV lesion size and mismatch in our study was skewed toward patients with small lesions and large mismatch, respectively (figure 2). This reflects our selection methodology. We do give the benefit of doubt to the patient—for example, those who present early are of a younger age or may have more eloquent brain involvement. This ‘benefit of doubt’ is reflected in the outliers circled in figure 2. Imaging can only be helpful when used in the context of other clinical factors to tailor the treatment and not utilized as the sole triage methodology. In our analysis, CBV lesion size was the strongest imaging predictor of outcome and mortality. In the recursive partitioning analysis, the area of CBV abnormality was the only imaging predictor showing an impact in determining both outcome as well as mortality, especially in successfully recanalized patients. While recanalization remained the most important predictor of a favorable outcome (figure 3), patients with large CBV lesions (≥1370 mm2) did poorly despite recanalization. For mortality (figure 4), the primary break point was CBV lesion size. Patients with large CBV lesions had higher mortality despite recanalization than those with smaller lesions. Interestingly, an area of 1370 mm2 corresponds to just over one-third of the MCA territory when measured at the level of the basal ganglia. This is similar to the one-third CT hypodensity on a NCCT that has been used as an exclusion criterion for endovascular therapy in previous stroke trials.3 ,22 On the other hand, CBV/MTT mismatch, while being significantly associated with both outcome and mortality, was not a determinant of either when evaluated in the context of other clinical and imaging predictors, as demonstrated in the decision tree analyses (figures 3 and 4). Hence overall CBV lesion size was more important than the ‘penumbra in predicting functional outcomes. The likely explanation is that a patient may have a matched CBV/MTT defect or no ‘penumbra’ in a peripheral MCA branch (M2/M3) territory. In such a patient, because of the distal nature of the arterial occlusion, the area of brain showing an abnormal CBV is small and hence if successfully recanalized, the final infarct is small, resulting in a favorable outcome regardless of the matched CBV/MTT mismatch or lack of ‘penumbra’. In contrast, for proximal occlusions, ICA or MCA, the mismatch or penumbra may be more significant just by virtue of the fact that a larger territory is at risk. However, even in this group, the smaller the CBV abnormality, the better the functional outcome, and vice versa. That is why CBV, by possibly reflecting the overall amount of irreversibly damaged tissue and not just a ratio or percentage compared with the area at risk, may have a larger impact on outcomes. Revascularization of such irreversibly damaged brain may not only be futile but also risky.
As hemodynamic failure followed by functional impairment of neurons precedes loss of morphological integrity, the goal of imaging is to identify patients with functional but not cellular impairment. It is important to note that clinically it is difficult if not impossible to categorize a symptomatic stroke patient into the reversible or irreversible category. The classical stroke experiments23 defined core as the volume of brain that has irreversible metabolic and/or structural neuronal failure despite reperfusion. Likewise, from an endovascular perspective, infarct core can be said to represent a region of the brain that is resistant to vessel recanalization and the penumbra a part of the brain that is responsive to revascularization. Accurate identification of the core on imaging remains a topic of discussion. A non-contrast head CT provides useful information regarding irreversible damage, especially when used along with the Alberta Stroke Program Early CT (ASPECT) scoring system24 ,25 but the NCCT may not become abnormal until later in the stroke evolution and may have minimal or no abnormality early on. Diffusion weighted imaging, apart from anecdotal reports of its reversibility and its logistical concerns notwithstanding, probably offers the most reliable information regarding infarct core26 ,27
The role of MTT and CBV thresholds in determining reversible and irreversible ischemia is established in the literature.28 A similar distinction between oligemia and infarct can be made utilizing CBF and CBV.29 ,30 A decreased CBV as a predictor of infarct and increased MTT as a predictor of tissue at risk, because of its high sensitivity to vascular occlusion, are also documented.31 Application of the ASPECT scoring system in analyzing parametric perfusion CT showed that a CBV ASPECT score of >6 was the best predictor of a favorable outcome in patients receiving intravenous thrombolytic therapy and was superior to the NIHSS score and the NCCT.32 Other studies with similar application of the ASPECT scoring system have shown perfusion CT in general and CBV lesion size in particular to be strong determinants of functional outcome in stroke patients.24 ,33–36 We relied on visual assessment of the perfusion parameters to determine the abnormal regions of interest, which has shown to be a reliable methodology.37 ,38 A visual assessment may overestimate the size of the threatened tissue on MTT39 but such overestimation favors treatment (by overestimating the penumbra); an overestimated MTT will be a concern if it was resulting in excluding patients from treatment. The visual assessment may have advantage over complex quantitative analysis in terms of ease of use and decision making in the rapidly evolving ischemic stroke process. We used the area of perfusion abnormality instead of the volume as the measured parameter as that is what we use to assess the perfusion study in actual practice. We assure inclusion of as much of the anterior circulation as possible by setting the coverage to accommodate the majority of the ICA and the MCA vascular territories as these are the most devastating strokes. Newer scanners that may allow whole brain perfusion have an obvious advantage in determining the entire extent of the threatened or infarcted brain but we demonstrate that even by using limited coverage that is appropriately centered can have an impact on patient selection. Such information is valuable in disseminating this technique as a screening or triage methodology has to have wide implementation for it to be relevant in its impact. We have listed the absolute values for a given perfusion parameter based on the software that we used (table 2). We realize that these values may be different based on the vendor software or the technique utilized to generate the perfusion maps.20 ,40 The values that we present are specific to our technique; however, these may be used as a baseline for comparison with other vendor software or as a reference for someone using similar techniques and software. To limit the impact of vendor variability, we also report the relative perfusion abnormalities for each parameter. Our data show (table 2) that about a 50% change in values was required to perceive a perfusion abnormality for all of the parameters.
For perfusion imaging to be integrated into a triage strategy for patients with acute ischemic stroke it has to demonstrate its impact in determining outcomes. Specially, for endovascular therapy for which there are no standardized inclusion criteria, such information in predicting irreversible brain injury at the time of intervention can be useful in improving the efficacy of the procedure and in preventing patients from undergoing a risky and/or futile intervention. A recent study demonstrated improved functional outcomes in patients undergoing endovascular stroke therapy when an imaging based patient selection was incorporated in the triage strategy.9 The ease of use of CTP,41 the reliability of the information obtained from it and most importantly the cost benefits of a CTP based triage make it a very desirable modality in stroke triage.42 Future trials43 may show a further benefit of this modality.
Limitations
The major limitation of our study is its retrospective nature and the relatively arbitrary patient selection methodology based on perfusion imaging. Moreover, our perfusion CT methodology and coverage has evolved over the years to reflect new techniques and more coverage. We use the lowest possible radiation dose in compliance with the recommended literature.44 Our goal was not to analyze the technical aspects of perfusion imaging but to understand whether perfusion imaging the way we have used had an impact on our patient population. We tried to minimize this heterogeneity in technique by re-processing all source data with the same algorithm and software but despite that we realize that the limitation exists. Our current analysis was also limited to anterior circulation strokes. However, we are in the process of analyzing similar data for the posterior circulation. We hope that within these limitations we have demonstrated an impact of pre-intervention imaging on clinical outcomes, which is the ultimate goal for endovascular stroke therapy. Perhaps future studies can be designed prospectively with standardized and uniform perfusion protocols to study this impact.
Conclusion
Patients who are candidates for endovascular stroke therapy can benefit from the added information obtained from CTP imaging. Of all the parameters, the size of the CBV abnormality is the strongest predictor of outcome and mortality as it may reflect the extent of irreversible ischemic damage. In our data set, more than a third of the CBV abnormality in the MCA distribution portended a poor outcome and a higher mortality despite recanalization. Of course, perfusion imaging is only one component of the decision making process for stroke interventions. We do not advocate patient selection based solely on one variable whether imaging or time but rather individualizing treatment based on a combination of clinical and physiological factors. As such, perfusion imaging may be able to provide a rapid physiological assessment in stroke patients. Such information can increase the confidence with which a treatment decision is made and can improve the effectiveness of the endovascular procedure by improving clinical outcomes which is the ultimate goal of endovascular stroke therapy.
References
Footnotes
-
Competing interests None.
-
Ethics approval Ethics approval was provided by the institutional review board.
-
Provenance and peer review Not commissioned; externally peer reviewed.