Article Text

Abstract
Objective Periprocedural intracranial hemorrhage secondary to intranidal flow redirection may develop after arteriovenous malformation (AVM) embolization. We hypothesized that continuous draining vein pressure monitoring may identify clinically relevant hemodynamic changes during devascularization. Our goal was to characterize the draining vein pressures in a swine rete mirabile AVM model during embolization with Onyx.
Methods An acute swine AVM model was constructed in six animals. Baseline, transoperative and final AVM area measurements were used to determine the degree of AVM embolization. Continuous video recordings were captured at 10 s intervals of active embolization. Draining vein pressure, arterial feeder pressure and heart rate were continuously monitored.
Results The baseline and post-embolization mean draining vein pressures were 49.8±17.2 and 33.0±11.7 mm Hg (p=0.01), mean arterial pressures were 79.8±19.4 and 79.6±25.2 mm Hg (p=0.94), mean transnidal pressures were 35.8±19.7 and 45.4±33.7 mm Hg (p=0.37) and mean heart rates were 81.1±11.9 and 83.1±12.8 bpm (p=0.38), respectively. The draining vein pressure was averaged according to the degree of AVM embolization and represented as a relative change compared with the baseline draining vein pressure, and the slopes were found to decrease in all cases (p=0.02). In half of the animals the draining vein pressure decreased progressively as the AVM was embolized. In the remaining animals the venous pressure only started to decline after the AVM had been devascularized by > 50%.
Conclusions The draining vein pressure response during Onyx embolization in the swine AVM model is heterogeneous. Continuous draining vein pressure monitoring is feasible and may potentially identify clinically relevant hemodynamic changes during AVM embolization.
- Angiography
- Arteriovenous Malformation
- Blood Pressure
- Liquid Embolic Material
- Vascular Malformation
Statistics from Altmetric.com
Introduction
Endovascular embolization is routinely used in the management of cerebral arteriovenous malformations (AVMs), and generally aims to facilitate the resection of larger malformations or to achieve cure in smaller lesions.1 ,2 Despite ongoing technological advances, the morbidity associated with endovascular treatment remains high, with complication rates ranging between 7% and 22%.3 ,4 A significant proportion of this morbidity arises from intracranial hemorrhage (ICH) in the immediate post-treatment period. Periprocedural ICH has been shown to correlate with poor clinical outcomes,5–9 and has been reported to be as common as 17%.3
A number of factors may contribute to post-embolization AVM hemorrhage. An often cited hypothesis is that, once an AVM has been partially embolized, the remaining compartments of the AVM are exposed to increased hemodynamic stress generated by the redirection of blood flow. This abrupt hemodynamic change leads to rupture of the thin-walled AVM vessels.7 Several series have shown that the risk of ICH increases with increasing nidal embolization, particularly when >60% of the AVM nidus is obliterated in a single embolization session.5 ,7 ,9 Previous investigations have shown that venous outflow restriction secondary to stenosis or occlusion correlates with higher AVM rupture risk, presumably due to increased intranidal pressure.10–12 The hemodynamic changes occurring in the draining vein during AVM embolization are not known.13–16
The purpose of this study is to characterize the draining vein pressures (VPs) in a swine rete mirabile (RM) AVM model during embolization with the liquid embolic agent Onyx, an ethylene-vinyl alcohol copolymer (ev3, Covidien Vascular Therapies, Mansfield, Massachusetts, USA). We hypothesized that the draining VP decreases as AVM embolization progresses, and that continuous VP monitoring may allow us to better understand the hemodynamic behavior of an AVM at various degrees of angiographic devascularization.
Methods
Six male Yorkshire swine aged 4–5 months and weighing a mean of 43.5±5.8 kg were used to construct the swine RM AVM models.17
AVM model
Swine RM has been used as an AVM model by a number of investigators.17–20 This structure is a fine vascular network located at the cranial base with a plexiform anastomosis between both sides (figure 1A). The RM is found at the terminus of the ascending pharyngeal arteries (APA) bilaterally, which is a main branch originating from the common carotid artery (CCA).

Swine rete mirabile arteriovenous malformation model. (A) Illustration representing the rete mirabile model. (B) Substracted anteroposterior angiogram showing the positioned guide catheters and appropriate trans-rete shunting (asterisks indicate guide catheters; arrowheads indicate ascending pharyngeal arteries; arrow indicates direction of blood flow through arteriovenous malformation model). (C) Unsubstracted anteroposterior image during embolization demonstrating the microcatheter, Onyx cast and pressure wire (dashed arrow indicates microcatheter; white arrow indicates pressure microwire).
The animals were premedicated with glycopyrrolate (0.01 mg/kg) intramuscularly and anesthesia was induced with telazol (4.4 mg/kg) and xylazine (2.2 mg/kg) intramuscularly. General anesthesia was maintained with inhalation of 1–2% isofluorane after orotracheal intubation. The right femoral artery was accessed using a cutdown technique and a 6 Fr introducer sheath was inserted. A left cervical incision was made, the left carotid exposed, ligated caudally and punctured at its mid-segment to advance cranially a 6 Fr introducer sheath. Heparin (150 IU/kg) was given as an intravenous bolus after the sheaths were secured. A 6 Fr Envoy guide catheter (Codman, Raynham, Massachusetts, USA) was navigated into the right CCA under fluoroscopic guidance and subsequently into the right APA where it was positioned and tightly fit beyond the origin of the occipital artery. Angiographic injections through the guide catheter were performed with 5 ml pure iohexol contrast media (Omnipaque 300 mg/mL; GE Healthcare, Princeton, New Jersey, USA). In order to generate a pressure gradient resembling an AVM through the RM, a 6 Fr Envoy catheter was advanced over a glidewire under roadmap guidance into the distal left CCA and into the left APA in the same fashion. A three-way stopcock was used at the hub to open the catheter to atmospheric pressure during the embolization, allowing cross flow from the right (‘arterial’) side to the left (‘venous’) side, through the bilateral RM, mimicking an AVM. Angiograms were performed through the APAs with the hub opened and closed to confirm the occlusive position of the catheter and to characterize an appropriate trans-rete shunting (figure 1B).17 Intermittent angiographic runs were carried out to confirm the patency of and absence of vasospasm within the APAs. Angiograms were obtained in anteroposterior (submentooccipital) projection in a Siemens Axiom-Artis biplane angiography system. A Prowler 14 microcatheter (Codman) was advanced into the distal right APA and a previously calibrated Primewire Prestige pressure guide wire (model 8185, Volcano Corp, Rancho Cordova, California, USA) was advanced into the distal left APA (figure 1C). A GE-Dash 3000 blood pressure monitor was connected to the pressure wire for continuous measurement of left APA (‘draining vein’) pressure. The arterial line was connected to the 6 Fr guide catheter in the right APA to obtain continuous arterial feeder pressure readings.
Embolization technique and imaging data processing
After the Onyx 18 was shaken in a mixer for 20 min, 0.4 ml dimethyl sulfoxide was injected over 1 min, followed by Onyx embolization at a rate of approximately 0.3 ml/min under continuous video recording. Arterial feeder pressure, draining VP and heart rate were documented continuously throughout the entire procedure.
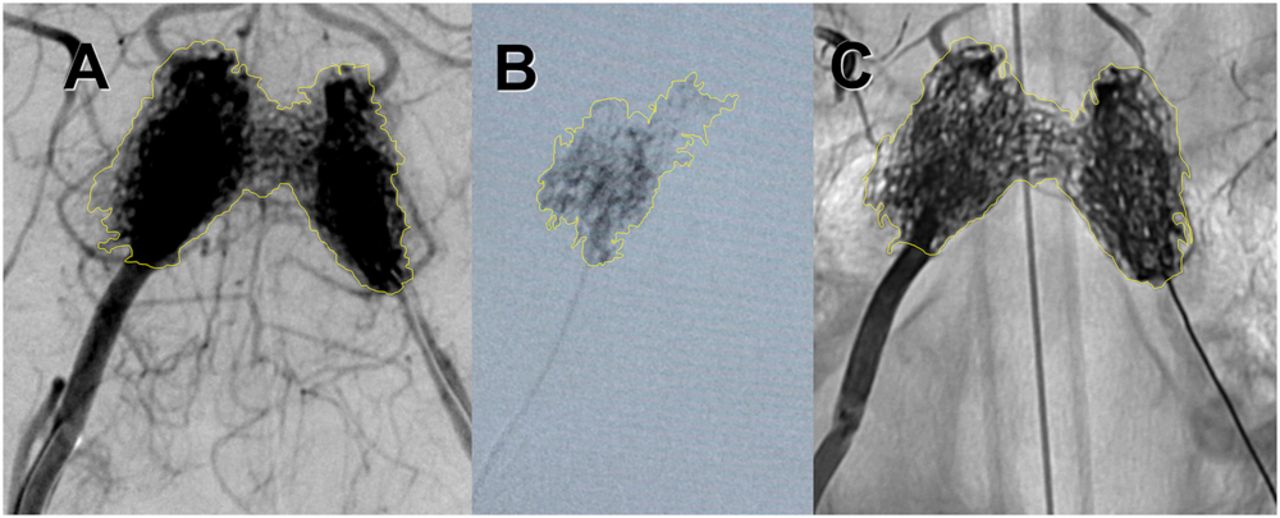
The baseline AVM area was retrospectively determined with Image J V.1.46 software (National Institutes of Health, Bethesda, Maryland USA). Two authors independently delineated the perimeter of the RM free hand in a right APA angiogram, and the area was automatically calculated for each of the swine (figure 2A). An excellent correlation coefficient was achieved (Spearman=0.99; p<0.01), and this technique was used for subsequent area measurements.

Method for measurement of baseline, partial and final degree of arteriovenous malformation model obliteration. The perimeter delineation (yellow line) for area estimation is demonstrated in a baseline right ascending pharyngeal artery anteroposterior angiogram (A), during partial embolization in a negative roadmap fluoroscopy (B), and in the final single shot angiogram showing the embolization cast (C).
Transoperative partial AVM embolization area measurements were performed through images captured at 10 s intervals of active embolization, allowing for post-procedure calculation of the degree of embolization at each interval (figure 2B). At the end of the embolization, the final Onyx cast area was calculated in a final single shot angiogram and used to determine the total AVM embolization percentage (figure 2C).
Statistical analysis
The results are reported as means±SDs. The mean draining VP recordings were averaged according to the degree of AVM embolization (1–25%, 26–50%, 51–75% and 76–100%) and represented as a relative change compared with the baseline draining VPs. A linear mixed model was used to evaluate the changes in mean draining VP according to the degree of embolization over time. The Kolmogorov–Smirnov test was used to evaluate for normality and a paired t test (one-tailed) was used to compare the baseline and final mean heart rate, arterial and draining VPs. The results were considered statistically significant if p<0.05. Statistical analyses were performed using IBM SPSS Statistics V.19.0.0.1 (IBM-Armonk, New York, USA).
Results
AVM model and general AVM embolization data
The general anesthesia and endovascular procedures were well tolerated and the AVM model was successfully constructed in all cases. The positioning and retraction of the pressure guide wire was uniformly uneventful. The mean active embolization time was 188±53 s (range 130–250) and the mean final percentage of AVM obliteration was 86.4±13.5%.
AVM hemodynamics during embolization
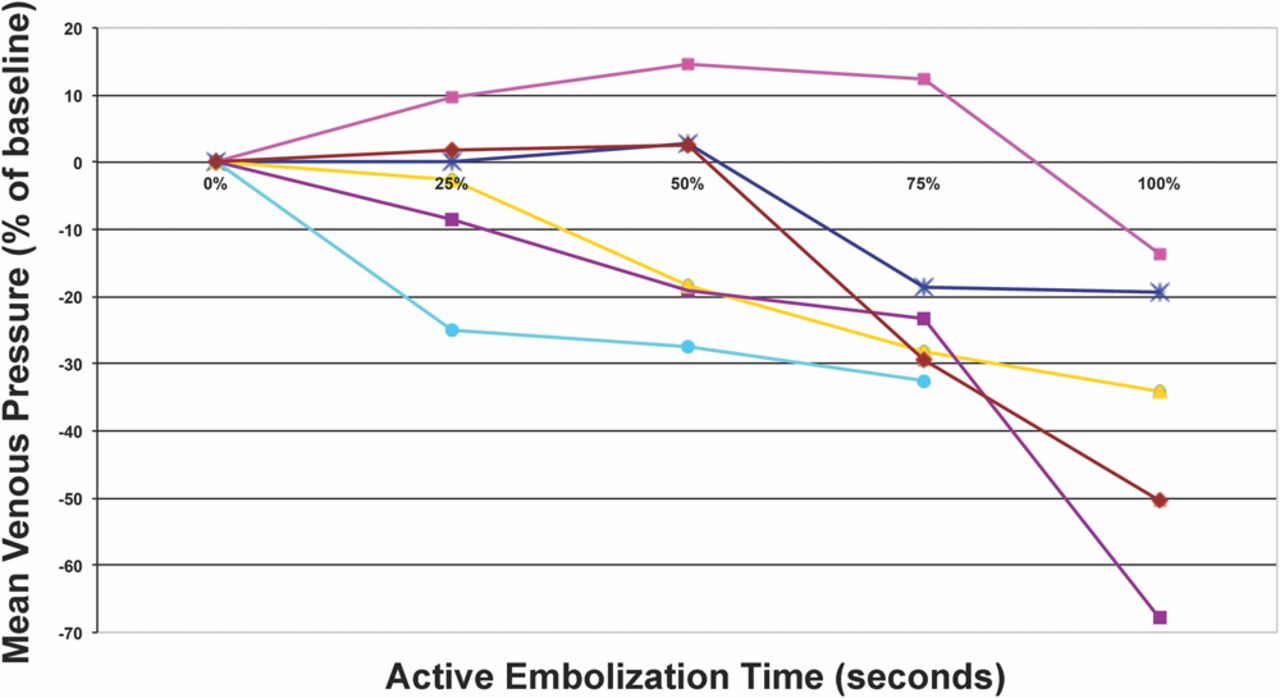
The baseline mean draining VP was 49.8±17.2 mm Hg, decreasing in all animals to a post-embolization mean of 33.0±11.7 mm Hg (p=0.01, figure 3). The slopes of relative draining VP according to the degree of AVM reduction decreased in all cases (p=0.02, figure 4). In half of the animals the draining VP decreased progressively and fairly linearly, related to the degree of AVM reduction. However, in the other half the VP levels were only noted to start declining after >50% of the AVM had been embolized (figure 4).

Mean venous pressures as a function of the active Onyx injection time.
Relative mean venous pressure change (percentage change in mm Hg compared with baseline) as a function of the degree of arteriovenous malformation embolization.
The baseline mean arterial pressure was 79.8±19.4 mm Hg and remained stable throughout the procedure in all animals. The final mean arterial pressure was 79.6±25.2 mm Hg (p=0.94). The baseline transnidal pressure was 35.8±19.7 mm Hg and increased to 45.4±33.7 mm Hg at the end of embolization (p=0.37). The average heart rate did not fluctuate during the interventions (81.1±11.9 bpm at baseline and 83.1±12.8 bpm at completion; p=0.38).
Discussion
The main finding in this study is that the draining VP changes in a heterogeneous fashion during Onyx embolization in the swine RM AVM model. Continuous VP monitoring is feasible and may potentially identify clinically relevant hemodynamic changes during AVM embolization.
Post-embolization ICH: arterial mechanisms
Perhaps the most feared complication after embolization of brain AVMs is periprocedural ICH. The mechanisms behind these hemorrhages are poorly understood. Several hypotheses related to changes in the arterial side of the AVM have been suggested.
One consideration is that hemorrhage may develop secondary to normal perfusion pressure breakthrough with hyperemia of adjacent brain. This may constitute the underlying cause in larger AVMs and in those with high-flow shunts (that present with steal or edema).21 ,22 Another mechanism involves an inflammatory reaction with mural angionecrosis secondary to the embolic material that may develop as early as 8 days after liquid embolic embolization and predispose to vessel rupture.23 Although this may contribute to or even constitute the main basis for hemorrhage in some patients, it is unlikely that this is the basis for the majority of the hemorrhages that develop over the first hours or days.
The evidence for increased feeding artery pressures after embolization is substantial.13 ,24 ,25 If the augmented pressure is transmitted to the remaining nidus or to a proximal feeding artery, hemorrhage may occur. Indeed, a relative increase in feeding artery pressure after embolization has been correlated with an increased bleeding risk.25 Furthermore, the increase observed in arterial feeding pressure after embolization appears to be proportional to the degree of AVM occlusion.13 Conservative embolization has therefore been recommended to avoid elevated feeding artery pressures.26 Ideally, one could continuously monitor feeding artery pressure as embolization progresses. The use of n-butyl cyanoacrylate (NBCA) or Onyx, however, permanently occludes the feeding artery and the delivery microcatheter and makes the use of the microcatheter for arterial pressure measurements impractical.13
Post-embolization ICH: venous mechanisms
Nornes and Grip originally described a significant drop in the draining VP in patients after surgical extirpation of AVMs and stated that “blood flow in veins has not received the attention it deserves …”.21 Subsequently, AVM venous drainage characteristics have been correlated with a higher risk of AVM rupture including deep venous drainage, single draining veins and draining vein vasculopathy (stenosis or occlusion).10–12 ,27 ,28 Similarly, direct obstruction of the main venous outlet by the embolic agent has been suggested to increase the risk of hemorrhage.29 ,30 Moreover, the obliteration of a substantial portion of an AVM can lead to stasis of the draining veins with resulting venous thrombosis.9 This may generate increased intranidal pressure on the residual nidus and result in hemorrhage.9 Therefore, VP monitoring may offer a unique method for continuous assessment of the hemodynamic status of the AVM during embolization.
Venous pressure monitoring in AVM
The accrued literature concerning venous hemodynamic characteristics in the perioperative period is scarce. Miyasaka et al16 performed intraoperative arterial feeder and venous drainage pressure measurement through direct vascular needle puncture and found significantly higher draining VPs in those AVMs that presented with hemorrhage. Young et al15 directly cannulated the draining veins during AVM resection and reported a significant postoperative fall in VP. Murayama et al18 investigated pre- and post-embolization VP in a swine AVM model. The authors evaluated microcatheter-derived VP measurements and documented a fall in VP and velocities at the completion of embolization. Nevertheless, no data assessing continuous hemodynamic monitoring during embolization are available. We hypothesized that monitoring of the VP during embolization would allow identification of VP changes representative of flow redistribution and compartmentalization. This could indicate an appropriate moment for interruption of embolization to avoid the risk of hemorrhage.
Our results showed that half of the swine had an early and progressive decrement in the VP throughout the procedure while the VP curves in the remaining swine only started falling after 50% of the AVM had been embolized. This pattern suggests that, even in a very homogeneous model, AVM hemodynamics and responses to embolization differ. Early downward sloping of the VP may indicate a relatively extensive nidal obliteration and suggests that nidal compartments could be at an increased relative risk of bleeding. Conversely, AVMs in which the VP slopes remain stable could possibly be further embolized until the VP starts to fall, which may indicate impaired venous drainage and elevated risks of rupture.
Considering that AVMs are complex and heterogeneous lesions, it is biologically unlikely that targeting a predetermined percentage of the AVM volume per session will accurately prevent ominous hemodynamic pressure redistribution in individual patients. Considering the paucity of data available for guiding the proportion of the AVM to embolize per session,5 ,7 ,9 the ability to monitor hemodynamic variables during embolization, such as draining VP, is appealing.
Our study confirms that continuous monitoring of the draining VP during Onyx embolization is feasible in the swine AVM model. Moreover, our data suggest that draining VP decreases as AVM embolization progresses, although not always immediately. The present findings indicate that the potential exists for continuous draining VP monitoring to guide the degree of AVM embolization, and further studies are warranted.
Limitations and strengths of the study
The current study has several limitations. While the RM provides a good model for less intricate AVMs,17 it is an imperfect AVM model as hemorrhage is not a measurable outcome. Therefore, only surrogate markers such as vessel wall histology or hemodynamics may be used. The sample was small and collateral arterial channels around the RM may have partially interfered with the absolute arterial/venous pressure measurements. Nevertheless, although the meaning of pressure changes remains speculative, monitoring of VP was feasible and consistent. The baseline VP measurements and the absolute VP fall after embolization in our study are consistent with previous descriptions of porcine RM hemodynamic endovascular measurements during embolization with particles and NBCA.18
Conclusions
Continuous monitoring of the draining VPs during liquid embolic embolization is feasible and potentially capable of identifying clinically relevant hemodynamic changes during AVM embolization. Further investigation of continuous VP measurements via ‘smart’ pressure wires during AVM obliteration is warranted.
Acknowledgments
We are grateful for the graphic support of Roberto Suarzo in preparing the images for this manuscript.
References
Footnotes
-
Contributors DCH: data collection, manuscript writing, statistical analysis. RA, JNJ, MSE, ECP and CB: data collection, critical review of manuscript.
-
LC: animal care, critical review of manuscript. MAA-S: study conception, data collection, critical review of manuscript.
-
Funding This study was supported by a grant from ev3, Covidien Vascular Therapies, Mansfield, Massachusetts, USA.
-
Competing interests MAA-S is a proctor for ev3/Covidien Vascular Therapies (Mansfield, Massachusetts, USA) and Codman (Raynham, Massachusetts, USA). The other authors report no conflicts of interest.
-
Ethics approval Ethics approval was obtained from the University of Miami Institutional Animal Care and Use Committee.
-
Provenance and peer review Not commissioned; externally peer reviewed.