Article Text

Abstract
Background Identifying infarct core on admission is essential to establish the amount of salvageable tissue and indicate reperfusion therapies. Infarct core is established on CT perfusion (CTP) as the severely hypoperfused area, however the correlation between hypoperfusion and infarct core may be time-dependent as it is not a direct indicator of tissue damage. This study aims to characterize those cases in which the admission core lesion on CTP does not reflect an infarct on follow-up imaging.
Methods We studied patients with cerebral large vessel occlusion who underwent CTP on admission but received endovascular thrombectomy based on a non-contrast CT Alberta Stroke Program Early CT Score (ASPECTS) >6. Admission infarct core was measured on initial cerebral blood volume (CBV) CTP and final infarct on follow-up CT. We defined ghost infarct core (GIC) as initial core minus final infarct >10 mL.
Results 79 patients were studied. Median National Institutes of Health Stroke Scale (NIHSS) score was 17 (11–20), median time from symptoms to CTP was 215 (87–327) min, and recanalization rate (TICI 2b–3) was 77%. Thirty patients (38%) presented with a GIC >10 mL. GIC >10 mL was associated with recanalization (TICI 2b–3: 90% vs 68%; p=0.026), admission glycemia (<185 mg/dL: 42% vs 0%; p=0.028), and time to CTP (<185 min: 51% vs >185 min: 26%; p=0.033). An adjusted logistic regression model identified time from symptom to CTP imaging <185 min as the only predictor of GIC >10 mL (OR 2.89, 95% CI 1.04 to 8.09). At 24 hours, clinical improvement was more frequent in patients with GIC >10 mL (66.6% vs 39%; p=0.017).
Conclusions CT perfusion may overestimate final infarct core, especially in the early time window. Selecting patients for reperfusion therapies based on the CTP mismatch concept may deny treatment to patients who might still benefit from reperfusion.
- CT perfusion
- Stroke
- Thrombectomy
Statistics from Altmetric.com
Introduction
The early restoration of cerebral blood flow (CBF) within the ischemic tissue is the only therapy of proven benefit in reducing infarct growth and promoting clinical improvement in ischemic stroke.
In the last few years the management of acute ischemic stroke has changed, after studies confirmed the efficacy of reperfusion therapies. At first, IV tissue-type plasminogen activator (tPA) proved to reduce disability after acute ischemic stroke,1 ,2 and in the last year clinical trials have shown the efficacy of endovascular therapy in treating patients with acute anterior circulation ischemic stroke.3–7 Selection of candidates for these procedures may require identifying infarct core or irreversible infarct on admission in order to establish the amount of salvageable tissue.8 Ideal candidates will present with a small ischemic core and a large penumbra.9 Theoretically, a timely reperfusion at this point will stop the progression of the irreversibly damaged core and lead to functional recovery of the remaining penumbral tissue at risk.
In this context, multimodal imaging techniques based on MRI8 ,9 or CT10 ,11 help identify target large vessel occlusions and can provide information about immediate time-dependent changes that follow the occlusion of a large cerebral vessel.
In recent years, multimodal imaging has been used to select patients with acute ischemic stroke for endovascular reperfusion therapies in clinical trials; EXTEND-IA4 and SWIFT PRIME7 ,12 demonstrated the effectiveness of mechanical thrombectomy in patients with large vessel occlusion and salvageable tissue defined as the mismatch between the infarct core and the hypoperfused area.
The infarct core area is typically depicted by diffusion sequences on MRI8 ,9 or by cerebral blood volume (CBV)13 ,14 or CBF15 ,16 on CT perfusion (CTP) studies. While diffusion-weighted imaging (DWI) abnormalities reflect actual histological changes that occur as a consequence of cerebral ischemia, the CTP abnormalities that are interpreted as infarct core solely represent the absence of contrast arrival into the severely hypoperfused brain regions. The definition of these areas as irreversible lesions comes from studies showing that CBV maps reliably predict the final infarct on follow-up imaging.13 ,15–17 These studies were done under specific time from onset to imaging and time from imaging to reperfusion conditions. Recent therapeutic, technical, and organizational advances are leading to significant decreases in these time frames, creating a scenario in which the value of CTP as a marker of infarct core is not validated.
We aim to describe the value of CBV in different time frames as a predictor of infarct core and to characterize those cases in which the admission core lesion on CTP does not reflect an infarct on follow-up imaging.
Methods
We studied consecutive stroke patients with internal carotid artery (ICA) and/or middle cerebral artery (MCA) occlusion who received at baseline a multiparametric CT (non-contrast CT+CTP+CT angiography) and underwent endovascular procedures in our comprehensive stroke center over a 3-year period. Inclusion criteria were as follows: clinical symptoms of acute stroke with a National Institutes of Health Stroke Scale (NIHSS) score >5, patients aged >18 years, prior modified Rankin scale (mRS) <3, could be treated with IV tPA if eligible, and full imaging investigation with the aim of initiating endovascular therapy within 8 hours from symptom onset. Only patients with known time of symptom onset were included in the analysis. The study protocol was approved by the local ethics committee.
The indication for endovascular treatment was based on an Alberta Stroke Program Early CT Score (ASPECTS) >6 on a non-contrast CT scan (NCCT) and not on CTP findings. Endovascular procedures were performed by experienced interventionalists using commercially available stent retrievers and aspiration catheters. At the end of the procedure recanalization was assessed; complete recanalization was considered if the Thrombolysis In Cerebral Infarct (TICI) score was 2b or 3. Time of symptom onset, time to CTP, and time to recanalization were recorded. The final infarct volume was measured on the follow-up 24–36 hour CT scan. We arbitrarily defined ghost infarct core (GIC) as initial core minus final infarct >10 mL or >20 mL in those cases in which the final infarct was significantly smaller than the observed core on admission CTP. We analyzed whether any clinical or radiological variables could be related to GIC. Twenty-four hour NIHSS improvement was considered when a decrease of ≥4 NIHSS points from baseline was observed. The mRS score was used to assess functional outcome at 90 days; a favorable outcome was defined as mRS 0–2.
Imaging protocol
CTP was performed on a Definition AS Siemens (Siemens, Erlangen, Germany) 128-section scanner with the following parameters: collimator of 32×1.5 mm, 80 kVp, and 200 mAs with total coverage of 86 mm. The plane of imaging was parallel to the floor of the anterior cranial fossa starting just above the orbits. Thirty cycles were obtained with a total scan time of 46 s. CTP data were analyzed using Syngo MMWP station (Siemens) using VPCT perfusion software which, based on presented values of CBF and CBV, automatically calculates the non-viable and penumbra tissue. The baseline infarct core volume (mL) was calculated based on CTP using a threshold of 1.5 mL/100 mL volume on CBV. The anterior cerebral artery was manually used for arterial input function. Admission core volume was later measured on baseline imaging.
Image analysis
All images were transferred to a separate workstation for analysis using a DICOM viewer (Osirix 64-bit; Pixmeo, Geneva, Switzerland). Variable window width and center level settings were used for optimal ischemic hypoattenuation detection with non-contrast CT images. Admission infarct core was measured on initial CBV and final infarct volume on follow-up imaging at 24–36 hours on NCCT by consensus between two vascular neurologists at the same time using the (A×B×C)/2 formula.18
Statistical analysis
Descriptive and frequency statistical analyses were obtained using SPSS V.17.0 software. Categorical variables are presented as absolute values and percentages and continuous variables as median±SD if normally distributed or median (interquartile intervals) if not normally distributed. Statistical significance for intergroup differences was assessed by Pearson χ2 test or Fisher exact test for categorical variables and by the Student t-test or Mann-Whitney U test for continuous variables.
Multivariable logistic regression analyses were used to determine factors that could be considered as independent predictors of favorable outcome. A Receiver Operating Characteristic (ROC) curve analysis was used to calculate the best cut-off time point after which the GIC becomes irrelevant. A probability value of <0.05 was considered significant for all tests.
Results
Seventy-nine patients were included in the study; the characteristics of the patients are shown in table 1. Median baseline NIHSS was 17 (11–20) with median time from symptoms to CTP of 215 (87–327) min. Occlusion locations were as follows: 35 (44.3%) MCA-M1, 16 (20.2%) MCA-M2, 7 (8.8%) tandem ICA/MCA, 21 (26.5%) terminal ICA. Forty-six patients (58.2%) received IV tPA before the endovascular procedure. The complete recanalization rate was 77%. Median time from CTP to recanalization was 119 (88–159) min. Median NIHSS at 24 hours was 11 (3–19). Twenty-nine patients (39.7%) achieved a good functional outcome (mRS ≤2) at 90 days.
Baseline characteristics
Median CBV infarct core was 27 (2–65) mL and median final infarct volume was 12 (2–45) mL. Thirty patients (38%) presented with a GIC >10 mL, of which 22 (29%) had a GIC >20 mL (see table 2). In the univariate analysis, GIC >10 mL was associated with recanalization (TICI 2b–3: 90% in GIC >10 mL patients vs 68% in non-GIC patients; p=0.026) and showed a statistical trend with admission glycemia (117±27 vs 132±54 mg/dL; p=0.199) and early time to imaging (165 (66–323) vs 222 (118–340) min; p=0.138). ROC curve analysis showed respective cut-off points of 185 mg/dL for glycemia (percentage of patients with glycemia <185 mg/dL: 42% in GIC >10 mL patients vs 0% in non-GIC patients; p=0.028) and of 185 min for time to imaging (percentage of patients with time to imaging <185 min: 51% in GIC >10 mL patients vs 26% in non-GIC patients; p=0.033) as best predictors of GIC >10 mL.
Clinical outcomes and lesion volumes
Patients with GIC >10 mL showed better rates of clinical improvement (percentage of patients with decrease in NIHSS of 4 points at 24 hours: 66.6% vs 39%; p=0.017) and a more favorable long-term outcome (mRS 0–2: 61.1% vs 27.3%; p=0.036).
A logistic regression model adjusted for recanalization, time to imaging, and admission glycemia found time from symptom to CTP imaging <185 min as the only predictor of GIC >10 mL (OR 2.89, 95% CI 1.04 to 8.09).
Discussion
Our study shows that the ability of CBV-CTP to define the irreversible infarct core on initial acute stroke assessment depends on the time from symptom onset to imaging. GIC may be a relatively frequent phenomenon in patients who undergo early imaging as overestimation of infarct core seems to increase as time from onset to imaging decreases.
A possible explanation may rely on the fact that CBV abnormality reflects a lack of contrast arrival19 into that brain tissue but not an actual histological change as depicted by DWI-MRI. The most severely hypoperfused areas will be the ones developing the irreversible infarct faster. Therefore, this is a time-dependent relation that may not be true if imaging is done very early and complete recanalization occurs very fast. The good correlation between CBV and final infarct was described in scenarios in which imaging was performed at later time points (in most studies >180 min from symptom onset) and/or recanalization occurred at a lower rate and later (in most studies endovascular treatment was not predominant).10 ,13 ,15 Moreover, the recent studies concluding that ischemic core on admission CTP predicts final infarct in patients with acute stroke treated with reperfusion therapies did not include in the inclusion criteria those patients with large core lesions and no mismatch on baseline CTP.12 This specific group of patients which are prone to present with GIC were included in the present study since the decision to perform thrombectomy was based on ASPECTS ≥6, independently of CTP results.
Recent studies have suggested that CBV lesions within 3 hours may not necessarily represent irreversibly dead tissue20 or that the initial ASPECTS-CTP lesion may be larger than the final infarct.14 We aim to better characterize the frequency and features of this circumstance in the era of hyperacute mechanical thrombectomy. According to our findings, in order to observe the GIC phenomenon, CTP must be performed early after symptom onset and recanalization must occur shortly after imaging. Moreover, conditions that can accelerate infarct growth during the time of ischemia such as hyperglycemia21 are inversely associated with GIC.
In recent years the development of stroke policies and campaigns in parallel with new endovascular devices and treatments has led to a substantial improvement in workflow times. Patients get to the hospital earlier and intra-hospital circuit changes often make door to imaging times of <20 min possible. Moreover, the use of multiparametric imaging that was often restricted to patient selection in the late time window (>3 or >6 hours from symptom onset) is being increasingly used in all patients. Together with these organizational changes, the development of improved mechanical thrombectomy devices such as stent retrievers allows faster and higher rates of complete recanalization. In this new scenario, observations that led to validation of CTP as an effective tool to identify infarct core may lose accuracy.
The infarct core/hypoperfused area mismatch concept is commonly used to select those patients who will respond to reperfusion treatments and to reject those who do not have salvageable tissue.7 ,9 Other studies used infarct core size on admission to describe the maximal core volume on admission compatible with long-term favorable outcome.22 These approaches may become unreliable if the observed core on admission is reversible. While they are still valuable for ensuring a high rate of recovery among patients selected for reperfusion, they can deny treatment to patients who could benefit from reperfusion.
Classic studies showed a good correlation between the initial lesion characterized by decreased CBV and final infarct volume.13 However, recent evidence suggests that there are cases where, after thrombolytic therapy, follow-up infarct volumes are smaller than admission CBV lesions.14 Our findings, in line with this, suggest that CBV reduction does not necessarily reflect infarction and this overestimation happens predominantly within 3 hours from symptom onset.
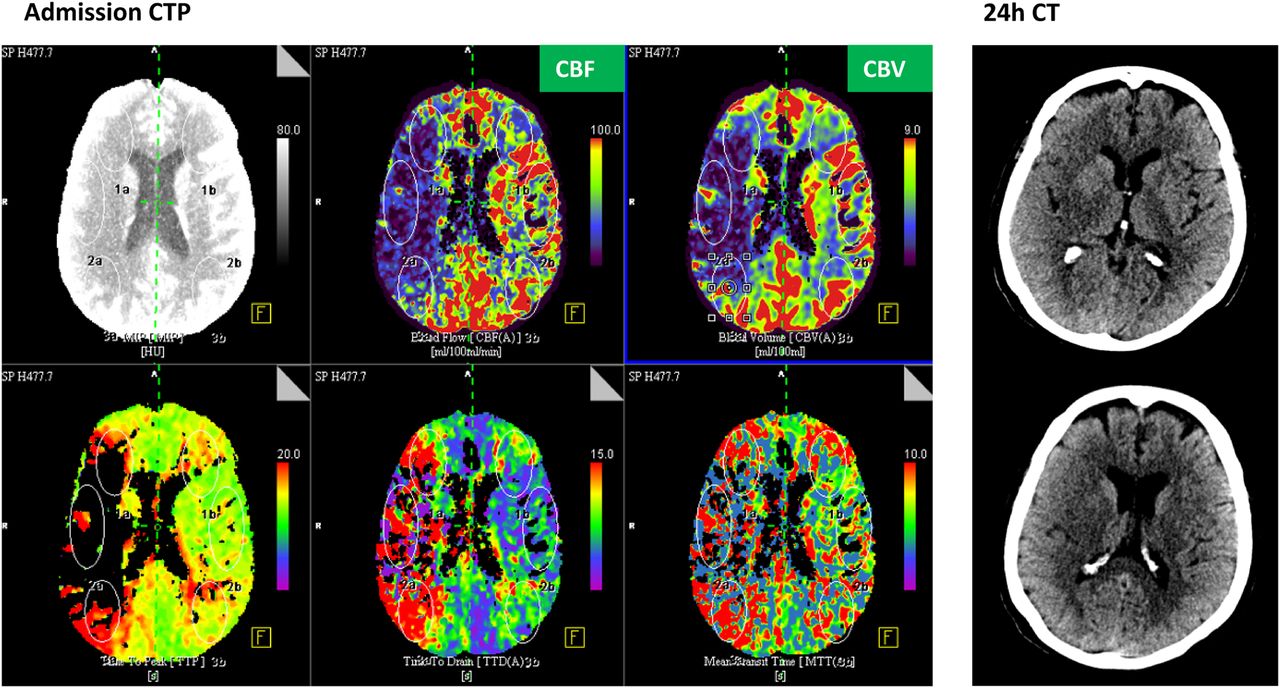
CBV is defined as the volume occupied by blood vessels with a particular part of the brain as opposed to DWI which is able to identify cytotoxic edema.23 CBV is therefore a hemodynamic measurement rather than a metabolic measurement. Changes in CBV are used to discriminate between viable and non-viable tissue states. Initially, following arterial occlusion, autoregulatory vasodilation and collateral flow recruitment attempts were made to normalize parenchymal blood flow to maintain compensatory neurobiochemical mechanisms.17 When cerebrovascular autoregulation is exhausted by prolonged or severe ischemia, the CBV and CBF precipitate irreversible tissue damage, resulting in the infarct core if not quickly reperfused. Some authors consider CBF to be a better predictor of infarct core than CBV.15 We did not specifically address the frequency of the ghost core phenomenon on CBF maps, but we identified several cases in which initial CBF lesions did not develop a final infarct on follow-up imaging, as seen in figure 1. We believe that, in order to maximize the predictive power of CTP maps to identify infarct core, different thresholds should be used according to time from onset. While the 1.5 mL/100 mL threshold that we used was found to be optimal after 3 hours, it is possible that a lower threshold would have depicted better the irreversible core in those patients imaged before 3 hours from onset. Further studies should investigate if the thresholds for either CBV or CBF should be lowered or tuned to increase the predictive power according to the time from onset to imaging or even according to other confounding factors such as hyperglycemia.

Patient with a final infarct volume on non-contrast CT at 24 hours that was smaller than the initial core volume on CT perfusion (CTP) at admission. In this patient the onset to CTP time was 51 min and the time from symptom to recanalization was 110 min. National Institutes of Health Stroke Scale at 24 hours was 2. CBF, cerebral blood flow; CBV, cerebral blood volume.
Another limitation of our study is that final infarct was measured on a control CT scan performed 24–36 hours after onset. We acknowledge that measuring infarct lesion on a follow-up DWI is more accurate and might possibly have led to a lower rate of GIC. Nevertheless, final infarct measurements on 24-hour CT scans are routinely done in all patients; using 24-hour DWI may induce an inclusion bias since most severe patients may not tolerate a follow-up MRI. Moreover, the parallel clinical improvement with lower neurological deficit observed in patients with GIC validates the hypothesis that these patients have lower final infarct volumes. It is also possible that the number of GICs may have been higher since some patients with apparently no mismatch may have been excluded from treatment and not included in the present study.
Conclusion
CT perfusion may overestimate final infarct core, especially in the early time window. Selecting patients for reperfusion therapies based on the CTP mismatch concept may deny treatment to patients who might still benefit from reperfusion.
References
Footnotes
Contributors MRi and SB participated in the conception and design of the study. MRi, MP and SB analyzed and interpreted the data. MRi, MRu, MM, DR-L, AF, NR, JJ and JP treated and included the patients in the study. MRi and SB performed the statistical analysis and wrote the article. All the authors reviewed and approved the manuscript.
Competing interests None declared.
Patient consent Obtained.
Provenance and peer review Not commissioned; externally peer reviewed.