Article Text

Abstract
Background Intracranial in-stent hyperplasia is a stroke-associated complication that requires routine surveillance.
Objective To compare the results of in vivo experiments to determine the accuracy and precision of in-stent hyperplasia measurements obtained with modified C-arm contrast-enhanced, cone-beam CT (CE-CBCT) imaging with those obtained by ‘gold standard’ histomorphometry. Additionally, to carry out clinical analyses comparing this CE-CBCT protocol with digital subtraction angiography (DSA).
Methods A non-binned CE-CBCT protocol (VasoCT) was used that acquires x-ray images with a small field-of-view and applies a full-scale reconstruction algorithm providing high-resolution three-dimensional (3D) imaging with 100 µm isotropic voxels. In an vivo porcine model, VasoCT cross-sectional area measurements were compared with gold standard vessel histology. VasoCT and DSA were used to calculate in-stent stenosis in 23 imaging studies.
Results Porcine VasoCT cross-sectional stent, lumen, and in-stent hyperplasia areas strongly correlated with histological measurements (r2=0.97, 0.93, 0.90; slope=1.14, 1.07, and 0.76, respectively; p<0.0001). Clinical VasoCT percentage stenosis correlated well with DSA percentage stenosis (r2=0.84; slope=0.76), and the two techniques were free of consistent bias (Bland–Altman, bias=3.29%; 95% CI −14.75% to 21.33%). An illustrative clinical case demonstrated the advantages of VasoCT, including 3D capability and non-invasive IV contrast administration, for detection of in-stent hyperplasia.
Conclusions C-arm VasoCT is a high-resolution 3D capable imaging technique that has been validated in an animal model for measurement of in-stent tissue growth. Successful clinical implementation of the protocol was performed in a small case series.
- Technology
- Stent
- Intervention
- CT Angiography
- CT
This is an Open Access article distributed in accordance with the Creative Commons Attribution Non Commercial (CC BY-NC 3.0) license, which permits others to distribute, remix, adapt, build upon this work non-commercially, and license their derivative works on different terms, provided the original work is properly cited and the use is non-commercial. See: http://creativecommons.org/licenses/by-nc/3.0/
Statistics from Altmetric.com
Introduction
Intracranial stenting is an effective therapy for specific cerebrovascular disorders, including medical treatment-resistant atherosclerosis,1 cerebral aneurysms,2–7 and arterial dissections.8 ,9 However, in-stent tissue growth, termed neointimal hyperplasia (NIH) and in-stent restenosis (ISR), is a significant long-term stroke-associated complication that requires routine surveillance of vessel anatomy.10 ,11 Catheter-based digital subtraction angiography (DSA) is the imaging standard for NIH/ISR detection; however, DSA relies on two-dimensional (2D) vascular representations that may over- or underestimate asymmetric tissue growth.12 Magnetic resonance angiography (MRA) and computed tomography angiography (CTA) are non-invasive 3D capable alternatives to DSA, but lack sufficient spatial resolution and suffer from implant-associated artifacts that diminish reliable visualization of in-stent vessel hyperplasia.13–17 Thus, a minimally invasive 3D capable, cross-sectional imaging technique with resolution to detect NIH/ISR would circumvent the former limitations, better inform clinicians, and potentially improve patient care.
Flat-detector C-arm cone-beam CT (CBCT) has shown to be a valuable imaging technique, providing in situ cross-sectional imaging with CT-like quality.18–22 CBCT data are generated from a large series of x-ray images acquired during a rotational sweep of the x-ray source and the detector around the patient. Generally, pixel binning of the x-ray images is performed to improve the signal-to-noise ratio, allowing for soft tissue contrast. VasoCT is a modification to the standard CBCT protocol that acquires x-ray images without pixel binning and a small field of view. As a result, VasoCT data can be generated with isotropic spatial resolution up to 67 µm at a trade-off of the signal-to-noise ratio. VasoCT has demonstrated detailed visualization of cerebrovascular stents,23 non-alloy microcannulas,24 and micro-sized arteriovenous malformations.25 Although qualitative evaluation of VasoCT has produced promising results, quantitative evaluation of the accuracy and precision of in vivo measurements has not been performed.
Herein, non-binned, high-resolution, contrast-enhanced VasoCT was quantitatively evaluated and compared with ‘gold standard’ vessel histology in a porcine model of in-stent tissue growth. Subsequently, gold standard clinical DSA measurements from a small patient group were compared with VasoCT to evaluate the accuracy of this protocol in the detection of NIH/ISR.
Materials and methods
In vivo animal experiment
Experimental design
All experiments were approved by our institutional animal care and use committee. An in vivo porcine model was used to quantitatively evaluate the ability of VasoCT to measure in-stent tissue growth relative to gold standard histomorphometry.26 ,27 Briefly, an adult Yorkshire swine (60 kg) was started on daily aspirin (81 mg) 3 days before the procedure. On day 0, the pig was anesthetized (intramuscular injection of tiletamine/zolazepam 5 mg/kg, xylazine 2.5 mg/kg, glycopyrrolate 0.01 mg/kg, and ketamine 2.5 mg/kg; followed by mechanical ventilation with 2% isoflurane), access was obtained via the right femoral artery, four distinct arterial areas were identified within the bilateral subscapular (pre-implant diameter of 2.1 mm) and right common carotid (pre-implant diameter of 4.3 mm) arteries by DSA, 5–10 mm of each area was damaged with a cutting balloon to intensify the hyperplasic response and then stented to cover the injured segment with four non-overlapping self-expanding intracranial stents (Wingspan, n=3: 4 mm×15 mm, 4 mm×20 mm, 4.5 mm×20 mm, Neuroform, n=1: 3.5 mm×15 mm; Stryker Neurovascular, Fremont, California, USA). The largest-diameter stent was used in the right common carotid artery, and the remaining stents were placed in the bilateral subscapular arteries. During the procedure an IV heparin bolus (100 U/kg) was administered and anticoagulation was monitored to maintain an activated clotting time >250 s. After the procedure, the pig was recovered alive and returned to the animal facility. On day 42, the daily aspirin was stopped. On day 49, the pig was anesthetized, access obtained via the left femoral artery, and DSA and VasoCT images were acquired (see ‘Image acquisition’ section). After image acquisition the animal was immediately killed, perfused under physiological pressure with saline followed by 4% paraformaldehyde, and stented vessels were explanted and prepared for histological analysis.
Image acquisition
VasoCT and DSA images were acquired using a monoplane neuroangiographic unit equipped with a 1920×2480 cesium iodide−amorphous silicon flat panel detector covering an area of about 30×40 cm (AlluraXper FD20; Philips Healthcare, Best, the Netherlands). DSA images were acquired using standard angiographic techniques. The VasoCT protocol acquires the projection images without pixel binning and with a reduced detector format of 22 cm×22 cm, which allows for higher spatial resolution than conventional CBCT.23 ,28 The motorized frontal C-arm was used to acquire 620 projection images over a 200° arc (rotation time, 20.7 s) at 80 kVp and a total of 260 mAs. During acquisition, 15% iodinated contrast in normal saline (Isovue 350; Bracco Diagnostics, Princeton, New Jersey, USA) was injected intra-arterially via a 6 Fr catheter (Envoy, Cordis Endovascular, New Brunswick, New Jersey, USA) positioned at the origin of the subscapular or common carotid artery at a rate of 2.5 mL/s for 23 s with a 3 s start delay. The source projection frames were acquired in a 10162 matrix covering an approximate 155×155 mm2 field of view, yielding a pixel size of 0.154 mm. The maximum 3D field of view was 106 mm in each dimension. All VasoCT images were reconstructed with a 5123 matrix centered about the stent, resulting in an isotropic spatial resolution of about 0.1×0.1×0.1 mm3. Postprocessing steps included gain calibration, scatter correction, white compression inversion, water beam-hardening correction, and Parker weighting. VasoCT datasets were further processed to reformations perpendicular to the stent region with a section thickness range of 0.067–0.1 mm. The radiation dose of a single VasoCT is about 49 mGy.23
Histological preparation
Explanted vessels were embedded in epoxy resin, and a high-resolution radiograph was acquired to co-register histological sectioning with previously acquired VasoCT data. The embedded vessels were then sectioned with a Buehler Diamond saw, lightly sanded, polished, stained (1% toluidine blue) and imaged using an Olympus AX90 microscope fitted with a Q-Color5 5MP digital camera system. Final vessel sections were about 60 μm thick.
Cross-sectional analysis
VasoCT cross-sectional images from each vessel were registered with corresponding histological sections accounting for section thickness, interslice distance, and distance from stent markers. A best-fit polygon was placed using ImageJ (NIH, Bethesda, Maryland, USA) to calculate in-stent and lumen area measurements for each VasoCT and histological image. For in-stent area measurements, a polygon point was placed at the luminal lateral surface of each stent strut; for luminal area measurements, numerous points were placed along the vessel's luminal surface. In-stent hyperplasia areas were calculated by subtracting each section's luminal area from its in-stent area. Correlation between VasoCT data and histology was established using a total of 26 independent measurements performed across the four implanted stents.
Statistical analysis
VasoCT and histology-derived measurements were compared with linear regression.
All statistical analyses were conducted with Graphpad Prism (V.6).
Clinical evaluation
Patients
This retrospective study was approved by our institutional review board. Patients (n=19) returning to our institution for post-stent intracranial vessel imaging examinations were included in the analysis (mean time between stent placement and follow-up examination=251 days, range=155–575 days). Only patients receiving both DSA and VasoCT evaluations at the time of post-stent follow-up were included; all other patients were excluded. All patients received intracranial stent or flow diverter placement for the treatment of atherosclerotic disease (Pharos Vitesse, Micrus Endovascular Corp, San Jose, California, USA, n=2; Wingspan, n=6; Neuroform, n=1; or aneurysms (Pipeline embolization device, Covidien/eV3, Mansfield, Massachusetts, USA, n=10). Stented intracranial vessels included the internal carotid artery (ICA; n=8), middle carotid artery (MCA; n=8) and vertebral arteries (n=4). Three patients returned twice for 6-month and 1-year follow-up examinations; both time points were included in the analysis. One patient had bilateral internal carotid artery stents placed; both stents were used for analysis. One patient was excluded owing to significant motion artifact, which limited the VasoCT image evaluation. In total, 23 independent imaging studies were available for analysis.
Image acquisition
The VasoCT imaging was performed similarly to the protocol used in the in vivo animal experiments; except, 20% iodinated contrast (Isovue-250; Bracco Diagnostics, Princeton, New Jersey, USA) was injected intra-arterially. Catheter type, location, and the injection parameters were used as previously reported.23 In two cases, contrast was administered intravenously using previously reported injection parameters,29—namely, 100 mL of contrast injected at 4 mL/s through an 18 g IV catheter placed in the right cubital vein. DSA was carried out using standard angiographic techniques.
Image analysis
VasoCT and DSA percentage stenosis was calculated from images of the vessel aligned along its long axis, as previously reported.30 If multiple views of the stented segment were available, DSA measurements were performed using the best possible image (eg, zoomed and oblique) acquired by the neurointerventional radiologist. Two luminal measurements were made per vessel for each imaging modality: the minimum in-stent diameter (Din-stent) as a measure of NIH/ISR and the proximal non-stented healthy vessel diameter (Dproximal) for normalization. The measurements for each vessel were made at the same location (approximate) for both VasoCT and DSA. If the proximal non-stented vessel was inadequate for analysis (eg, diseased segment), the distal non-stented healthy vessel diameter was used for normalization (n=3). Percentage stenosis was calculated by: 1
1
Statistical analysis
VasoCT and DSA-derived measurements were compared with linear regression and the Bland–Altman test.31 All statistical analyses were conducted with Graphpad Prism (V.6).
Results
In vivo animal experiment
When the porcine model was used, consisting of arterial damage, stenting, and a post-stent incubation period, a substantial area of in-stent tissue growth was created and visualized (figure 1A,B). The in-stent tissue growth, recognized as the non-contrast/hypodense area between the stent struts and contrast-filled lumen, was found to gradually taper in the proximal direction along the artery (figure 1B,C). To quantify the area of in-stent tissue growth, VasoCT vessel cross-sections were created and spatially matched to histological sections (figure 1C). VasoCT stent, lumen, and in-stent tissue growth area measurements were calculated from each cross-section corresponding to the histological sections, which is the gold standard for quantifying in-stent tissue growth (figure 2A–C). VasoCT stent, lumen, and in-stent tissue growth areas strongly correlated with histology-derived measurements (r2=0.97, 0.93, 0.90, respectively; p<0.0001). Moreover, the slopes of these relationships, which were between 0.9 and 1.14, and y intercepts, which were all <1 mm2, indicate an almost one-to-one relationship between VasoCT and histology, particularly for the stent area measurement, which was nearly identical between the two measurement methods. The non-zero y intercepts in figures 2B,C indicate a small bias between VasoCT and histology measurements of lumen area and in-stent tissue growth area. This bias is due to a slight but consistent overestimation of the VasoCT-calculated lumen area as compared with histology (figure 3A). This overestimation results in an underestimation of in-stent tissue growth area measured by VasoCT, and a decreased sensitivity for its detection (figure 2C,B). However, the threshold for detection of VasoCT is low and can visualize in-stent tissue growth ≥0.79 mm2 (figure 2C). VasoCT lumen area overestimation is probably due to partial volume errors, but vessel motion, noise, and contrast pulsatility may also contribute.
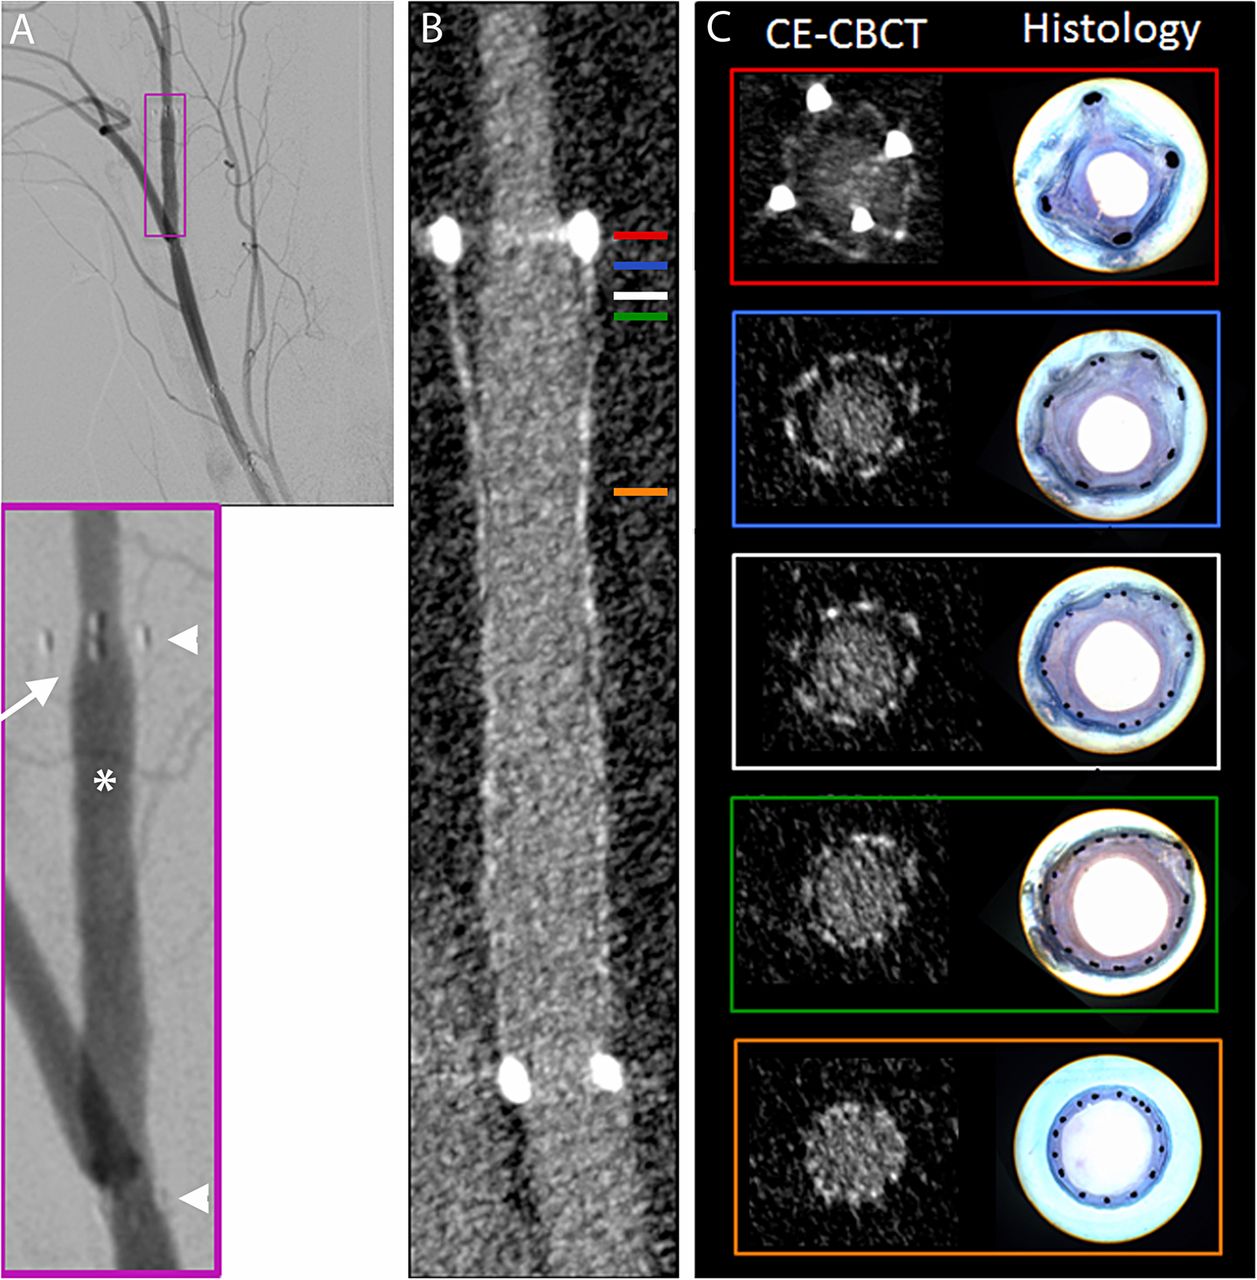
In-stent tissue growth visualized with digital subtraction angiography (DSA), VasoCT, and histology. (A) DSA image of stented right distal subscapular artery demonstrating in-stent tissue growth secondary to an arterial dissection (arrow); note proximal and distal stent markers (arrow heads), contrast filled lumen (asterisk), and gradual taper of in-stent tissue growth between vessel lumen and stent marker. (B) VasoCT image of the same artery as in A. (C) Representative and corresponding cross-sectional VasoCT (left) and histological (right) images; note significant in-stent tissue growth with distal to proximal taper; box colors correspond to approximate location of colored lines in (B). CE-CBCT, contrast-enhanced, cone-beam CT.

Cross-sectional VasoCT in-stent area measurements strongly correlate with histology measurements. (A) Linear regression of cross-sectional stent areas measured by VasoCT and histology (r2=0.97, slope=1.14±0.04, x intercept=0.69, y intercept=−0.78±0.28). (B) Same as A; lumen areas (r2=0.93, slope=1.07±0.06, x intercept=−0.82, y intercept=−0.87±0.32). (C) Same as A, B; in-stent hyperplasia areas (r2=0.90, slope=0.76±0.05, x intercept=0.79, y intercept=−0.60±0.13). n=26 and p<0.0001 for A–C. (D) Representative VasoCT (top) and histology-derived images (bottom) demonstrating cross-sectional measurement technique (see ‘Methods’); left, stent area; right, lumen area. Line thickness was enhanced for visualization. CE-CBCT, contrast-enhanced, cone-beam CT.

VasoCT overestimates cross-sectional lumen area relative to histology, resulting in decreased hyperplasia detection. (A) Representative VasoCT (left) and histological (right) mirror images from an identical arterial segment (approximate); stent, lumen, and in-stent hyperplasia are clearly visible, note increased VasoCT lumen area relative to histology lumen area. (B) VasoCT (left), histology (right); note thin circumferential area of hyperplasia on histology (arrow) not visible on VasoCT. CE-CBCT, contrast-enhanced, cone-beam CT.
To move to the clinical measurements presented below, we compared the percentage stenosis of each device implanted in the pig model measured by DSA and by VasoCT. The average difference between these two techniques was 9.2%. Using a non-parametric, paired t test we found no difference between the DSA and VasoCT percentage stenosis calculations. When compared by linear regression, the coefficient of determination was 0.98 and the slope was significantly different from zero (p=0.013).
Clinical evaluation
The former experiments confirm that quantification of in-stent tissue growth by VasoCT strongly correlates with gold standard histology in an animal model (see above); therefore, the next logical step was to evaluate VasoCT against the clinical NIH detection standard, DSA. To perform this analysis, intrapatient VasoCT and DSA in-stent percentage stenosis measurements were calculated and compared (figures 4A–D). VasoCT measurements correlated well with DSA measurements using a linear regression analysis (r2=0.84, p<0.0001; figure 4C). Bland–Altman analysis showed that VasoCT and DSA are equivalent and free of systematic bias when measuring patient in-stent NIH (bias=3.29%, SD of bias=9.20, 95% CI −14.75% to 21.33%; figure 4D).
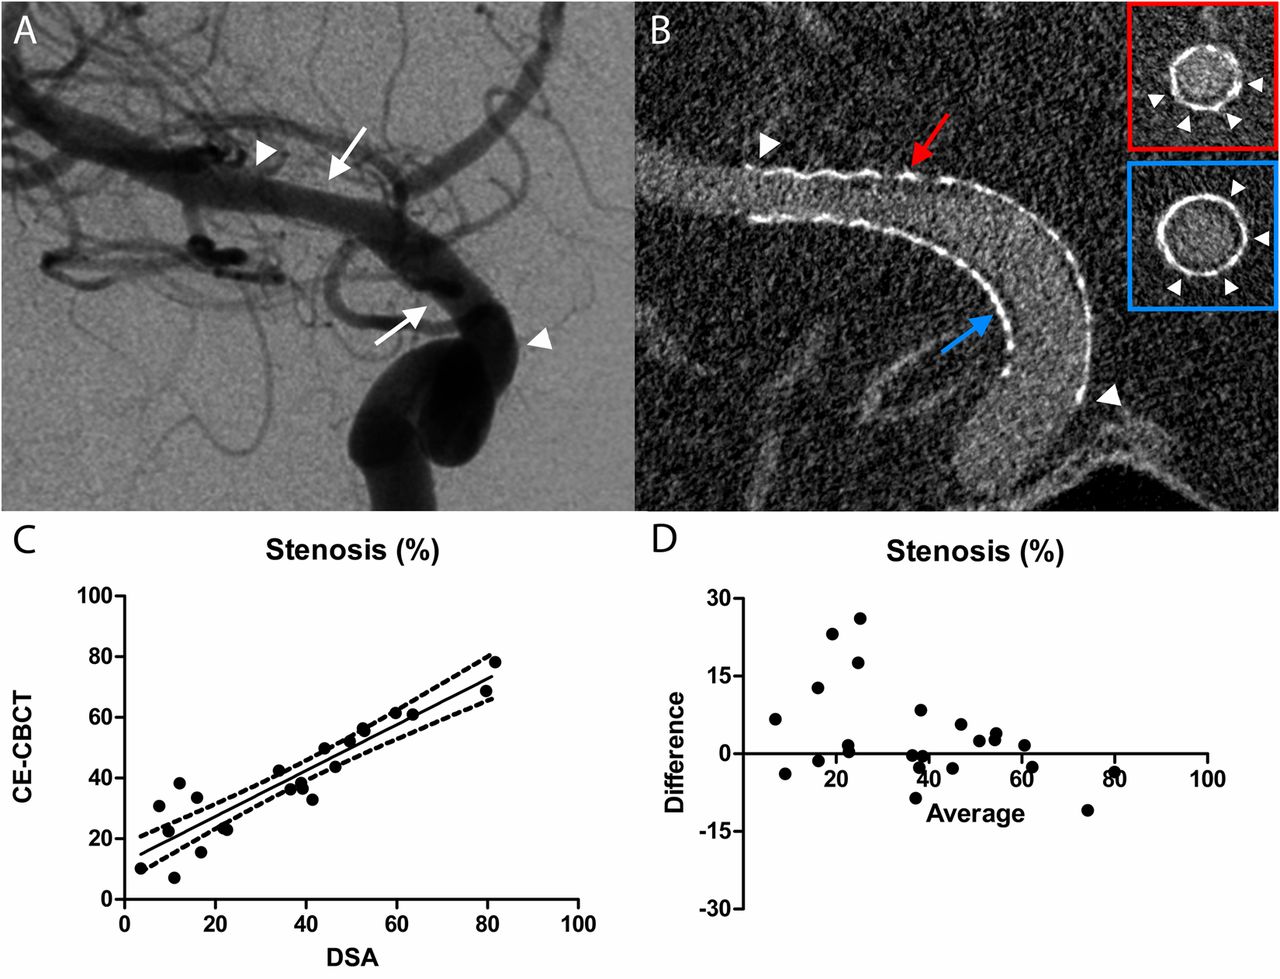
VasoCT is equivalent to the clinical standard, digital subtraction angiography (DSA), in measuring percentage stenosis. (A) Representative DSA image (frontal oblique projection) acquired at 6-month follow-up after treatment of an anterior choroidal artery aneurysm using a Pipeline embolization device. Proximal and distal ends of the stented segment are indicated (arrow heads). DSA demonstrates mild in-stent hyperplasia (arrows) of the distal internal carotid artery and proximal middle cerebral artery. (B) VasoCT data reformatted to a different orientation than DSA (oblique submental projection) in order to fully appreciate the stented segment (arrow heads) and areas of hyperplasia (arrows). Owing to the isotropic voxels of the VasoCT dataset, images can be reformatted to any orientation without loss of resolution (see insets showing vessel cross-sections). (C) Linear regression of in-stent percentage stenosis measured by VasoCT and DSA (r2=0.84, slope=0.76±0.07, x intercept=−16.10, y intercept=12.19±3.06). (D) Bland–Altman plot—difference between percentage stenosis measured by VasoCT and DSA for each examination plotted against their mean (95% CIs (−14.75% to 21.33%); bias=3.29%, SD of bias=9.20%. n=23 and p<0.0001 for C, D). CE-CBCT, contrast-enhanced, cone-beam CT.
Illustrative case
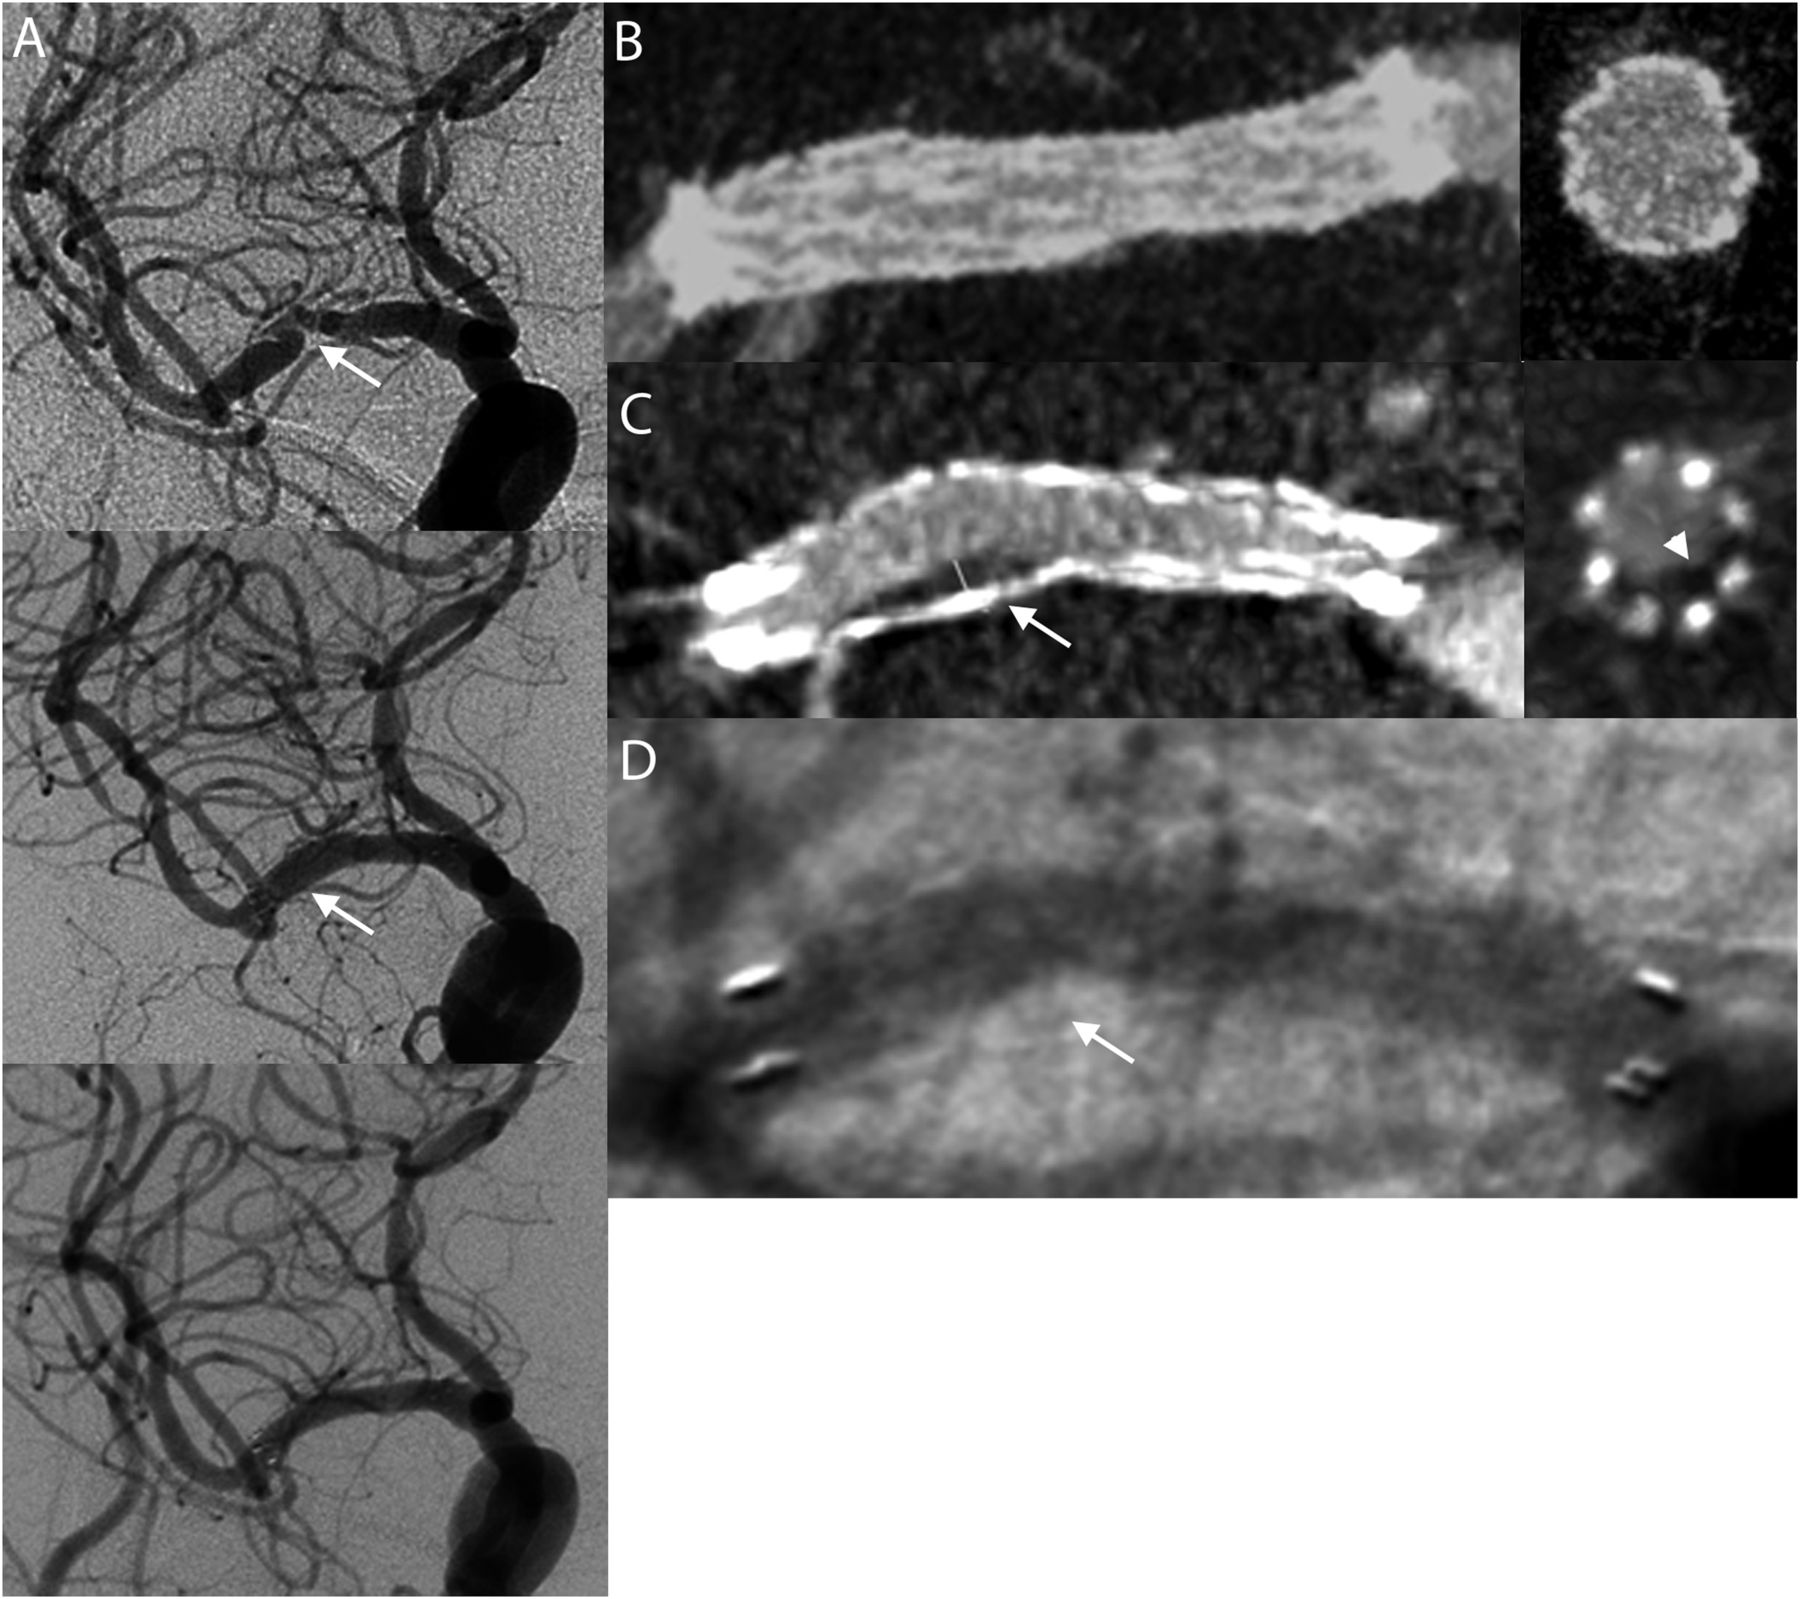
Briefly, a septuagenarian presented with left sided numbness, investigation, including MRI and DSA, showed right-sided temporal-parietal infarct secondary to right-sided MCA stenosis (>70%) (figure 5A, top image). To treat the symptomatic patient an intracranial stent was placed in the right MCA, which completely resolved the stenotic area as visualized with postintervention imaging (figure 5A, middle image, figure 5B). Six-month post-stent follow-up DSA imaging showed a fully patent in-stent vessel lumen (figure 5A, bottom image). However, concurrent VasoCT imaging detected an area of in-stent NIH (figure 5C). The area of NIH was visualized using cross-sectional vessel reconstructions available with VasoCT, but not with DSA. After the VasoCT acquisition, an oblique DSA image was acquired using projection angles derived from VasoCT data and resulted in DSA detection of the in-stent hyperplasia (figure 5D). This result is consistent with the suggestion that VasoCT and DSA are equivalent for in-stent NIH quantification when similarly oriented, but VasoCT provides better detection because DSA is dependent on the acquisition angle. Importantly, the VasoCT images contained within figure 5 were acquired using intravenously administered contrast, providing support for its potential as a non-invasive alternative to DSA.
Comparison of VasoCT with digital subtraction angiography (DSA) for the detection of in-stent hyperplasia. (A) Intra-arterial DSA images of a septuagenarian with left-sided numbness, pretreatment DSA image showing >70% stenosis of right middle cerebral artery (arrow, top image), post-stent DSA image showing complete recanalization of stenotic vessel lumen (arrow, middle image), 6-month post-stent follow-up demonstrating a fully patent stent lumen (bottom image). (B) Intravenous VasoCT images post-stent demonstrating a fully patent stent lumen with good stent vessel apposition (left, vessel long axis; right, vessel cross-section). (C) Intravenous VasoCT 6-month post-stent follow-up showing an extended (arrow) crescent shaped (arrow head) hypodense area consistent with in-stent restenosis (ISR) (left, long axis; right, cross-section). (D) 6-Month post-stent follow-up DSA image taken with C-arm rotationally aligned with viewing coordinates of image in C. Note an extended area of ISR can now be seen (arrow), similar in size and shape to that found in C.
Discussion
In-stent NIH of intracranial vessels is a serious long-term post-stent complication that requires routine surveillance of vessel anatomy.10 ,11 DSA is the clinical standard for in-stent NIH detection. However, DSA is limited by its inherent 2D nature, which may result in missed diagnoses.12 MRA and CTA are non-invasive 3D capable alternatives to DSA, but both lack sufficient spatial resolution and require advanced approaches to reduce implant artifacts and reliably visualize in-stent NIH.13–16 ,32 ,33 The advent of a clinical imaging technique which could circumvent these limitations would result in substantial improvement in patient diagnosis and care. We hypothesized that VasoCT, with its high spatial resolution and isotropic 3D capability might be a diagnostically better alternative for in-stent intracranial NIH detection.17 ,29 To test this hypothesis, VasoCT was validated in an animal model of in-stent tissue growth and in post-stent neurointerventional patients. When the animal model was used, quantitative VasoCT was found to strongly correlate with gold standard histological measurements, including stent, lumen, and in-stent tissue growth areas. However, consistent VasoCT lumen overestimation, due to partial volume errors, vessel movement during acquisition, backscatter, and noise, resulted in decreased in-stent tissue growth measurements and an increased detection threshold relative to microscopic examination of the explanted vessels. According to the linear model, the in-stent tissue growth should have an area of at least 0.79 mm2 in order to be detected by VasoCT. Despite this minor difference, the animal experiments proved that VasoCT vessel reconstructions reliably recapitulate and accurately measure long-term in-stent vascular pathology in a living biological organism, complete with cardiac pulsations, overlying soft and boney tissue, and vessel anatomy. Although the quantitative evaluation was performed using only a single animal, the four stented vessel segments used provided 26 independent measurements with sufficient variability in vessel size and degree of NIH for reliable analysis.
Given these encouraging results, it was no surprise that VasoCT also proved useful in the clinic. For instance, in our patient group VasoCT was as effective as DSA, the current clinical standard, at measuring in-stent percentage stenosis in follow-up examinations to evaluate in-stent NIH. Bland–Altman analysis showed that in four cases the agreement between the two measurements was reduced, with differences ranging from 12% to 26%. In these cases, VasoCT showed a higher percentage stenosis which was not visible on DSA owing to asymmetric NIH and non-optimal acquisition angle. Further, no systematic bias was found between the two measurement techniques. Thus, in our study VasoCT is equivalent to DSA, which agrees with previously reported findings34; however, for detection of eccentric in-stent NIH, 3D capable VasoCT appears to be better than DSA since these stenoses might be overlooked in cases of non-optimal angulation of the x-ray system (see ‘Illustrative case’, figure 5). Furthermore, there is strong preliminary evidence that CBCT acquired with intravenously administered contrast is effective for the detection of in-stent NIH, affirming its potential use as a non-invasive alternative to DSA17 ,29 ,34 ,35 (figure 5). However, validation of these results in a larger sample is needed. If confirmed, the clinical advantages of VasoCT for the evaluation of post-stent NIH would be numerous, as IV contrast-administered VasoCT (IV-VasoCT) would substantially reduce time, cost, and procedural complications related to invasive DSA. Furthermore, IV-VasoCT would reduce radiation exposure for the patient and interventionist, by requiring less radiation and freeing healthcare personnel from the patient's side during the examination.
There was very little in-stent stenosis in the flow diverter cases (mean in-stent stenosis 25%, range 3.5–53%). This is in agreement with published results, where in-stent stenosis is rare and generally mild.3 ,36–38 The ISR was more severe in cases where stenting was performed to treat intracranial atherosclerosis (mean ISR 49%, range 10–82%); which again reflects published values.39–42 In the animal experiment, we found that the sensitivity of VasoCT is better for larger areas of NIH. Translating this finding to our clinical series, the correlation improved when we excluded the aneurysm cases and only compared the more severe ISR from intracranial atherosclerosis (R2=0.90, p<0.0001).
Although the substantial benefits of VasoCT, relative to DSA, are evident, VasoCT is not without its own drawbacks. For example, VasoCT image interpretation is limited by metal artifacts and reduced field of view that does not capture the entire cerebrovasculature; however, techniques to reduce metal artifacts are improving.32 ,33 Additionally, although VasoCT can reliably detect and measure in-stent tissue growth, it is unable to determine the exact nature of the underlying vascular pathology. The technique requires a compliant patient who can endure a 20 s study without moving. Finally, as with CTA, VasoCT with contrast administered IV requires careful consideration of the patient's cardiac and renal function to determine tolerance to a relatively large bolus.
All things considered, VasoCT is an effective imaging technique for the evaluation of post-stent intracranial NIH and has great clinical potential. Study limitations include a small patient group with heterogeneous stented disorders. Larger clinical trials to deal with these limitations and to evaluate further the potential of IV-VasoCT as a non-invasive and diagnostically better alternative to DSA are needed.
Conclusions
Non-binned C-arm contrast-enhanced cone-beam CT, a high-resolution 3D capable imaging technique, has been validated against histomorphometry to reliably quantify in-stent tissue growth. Preliminary clinical data suggest that calculation of percentage stenosis using either VasoCT or DSA provides similar results. A large-scale clinical trial is needed to further evaluate the effectiveness of VasoCT with IV-administered contrast.
References
Footnotes
-
Authors TFF and IMJvdB contributed equally.
-
Meeting presentations: 2012 ASNR Annual Meeting; 2013 ASME Summer Bioengineering Conference; 2013 SNIS Annual Meeting
-
Contributors TFF: data analysis, manuscript preparation, manuscript approval. IMJvdB: study design, data acquisition, data analysis, manuscript preparation, manuscript approval. LS, ASP: data acquisition, data analysis, manuscript editing, manuscript approval. GHH: study design, data acquisition, manuscript editing, manuscript approval. AKW: study design, data acquisition, manuscript approval. MJG: study design, data acquisition, data analysis, manuscript preparation, manuscript approval. Guarantees the data integrity.
-
Funding This work was supported in part by a research grant from Philips Healthcare.
-
Competing interests AKW: consultancy for Johnson and Johnson, Codman Neurovascular and Stryker Neurovascular; grants/grants pending for National Institutes of Health and Philips Healthcare; payment for lectures (including service on Speakers Bureaus) for Harvard Medical School and Baptist Healthcare Miami; stock/stock options for Surpass Medical; travel/accommodation/meeting expenses unrelated to activities listed from Surpass Medical, Codman Neurovascular, Stryker Neurovascular, Covidien, and ev3 Neurovascular. MJG has been a consultant per hour for Codman Neurovascular, Surpass Medical Inc, and Stryker Neurovascular; receives research support from the National Institutes of Health, Codman Neurovascular, eV3 Neurovascular, Fraunhöfer Institute, Stryker Neurovascular, and Wyss Institute.
-
Provenance and peer review Not commissioned; externally peer reviewed.
-
Data sharing statement The corresponding author will provide: DICOM images of CT data and angiography; images of histology; and spreadsheet of all measurements. These data will be provided to any healthcare professional upon request.