Article Text

Abstract
Background Economic viability is important to any hospital striving to be a comprehensive stroke center. An inability to recover cost can strain sustained delivery of advanced stroke care.
Objective To carry out a comparative financial analysis of intravenous (IV) recombinant tissue plasminogen activator and endovascular (EV) therapy in treating large vessel strokes from a hospital's perspective.
Methodology Actual hospital's charges, costs, and payments were analyzed for 265 patients who received treatment for large vessel strokes. The patients were divided into an EV (n=141) and an IV group (n=124). The net gain/loss was calculated as the difference between payments received and the total cost.
Results The charges, costs, and payments were significantly higher for the EV than the IV group (p<0.0001 for all). Medicare A was the main payer. Length of stay was inversely related to net gain/loss (p<0.0001). Favorable outcome was associated with a net gain of $3853 (±$21 155) and poor outcome with a net deficit of $2906 (±$15 088) (p=0.003). The hospital showed a net gain for the EV group versus a net deficit for the IV group in patients who survived the admission (p=0.04), had a favorable outcome (p=0.1), or were discharged to home (p=0.03). There was no difference in the time in hospital based on in-hospital mortality for the EV group but patients who died in the IV group had a significantly shorter length of stay than those who survived (p=0.04). The favorable outcome of 42.3% in the EV group was significantly higher than the 29.4% in the IV group (p=0.03).
Conclusions Endovascular therapy was associated with better outcomes and higher cost–recovery than IV thrombolysis in patients with large vessel strokes.
- Economics
- Stroke
- Thrombolysis
- Thrombectomy
Statistics from Altmetric.com
Introduction
According to the American Heart Association's report on heart disease and stroke statistics, the total and direct costs of stroke in 2008 were $34.3 billion and $18.8 billion, respectively.1 The direct medical cost includes outpatient visits, inpatient costs, emergency room visits, medication, and home health providers. In 2009, the total and direct costs had risen to $38.6 billion and $22.8 billion, respectively.2 Inpatient care of acute events accounts for 70% of these costs.2 The mean cost of ischemic stroke care for each person in the USA in 2009 was estimated to be $6018 while the mean lifetime cost of ischemic stroke in the USA was estimated to be $140 048.2
Endovascular (EV) stroke therapy is facing head winds in the light of several recent trials showing the futility of such treatment.3 ,4 A target population needs to be demarcated based on specific ‘inclusion’ criteria that clearly tip the risk–benefit ratio in favor of an invasive procedure. Certainly, the presence of a large vessel occlusion is one such criterion,5 ,6 demonstrating a benefit for EV therapy over intravenous (IV) thrombolysis; however, it needs to be prospectively proved. As these criteria evolve, it is important that a parallel effort in demonstrating the impact of EV stroke treatment on healthcare costs is critically assessed. Prohibitive costs, especially with uncertain clinical benefits, will rightfully bring these interventions to an abrupt halt. Now more than ever, hospitals need assurance that a treatment will benefit patients and will not be an overwhelming burden on their finances. This paper compares EV and IV treatments, for the specific subgroup of patients with large vessel strokes, based on hospital data for costs and reimbursements.
Materials and methods
The goal of the study was to compare a hospital's costs and reimbursements for IV thrombolysis and EV therapy for acute ischemic stroke. Our hypothesis was that a higher reimbursement and increased rate of good outcomes associated with EV therapy might make it a more cost-effective treatment for large vessel strokes. After appropriate institutional review board approval, consecutive patients with large vessel occlusions who had undergone either IV thrombolysis with recombinant tissue plasminogen activator (rt-PA), alteplase (Activase, Genentech Inc, San Francisco, California, USA), or EV therapy and for whom the financial data were available were retrospectively analyzed. To achieve an accurate comparison, patients who had received both treatments were not included in the analysis. EV therapy included mechanical thrombectomy, local intra-arterial thrombolysis, or both. Patients who were eligible for IV thrombolysis received IV rt-PA according to standard guidelines. Patients who were not eligible for IV rt-PA were evaluated for EV therapy based on clinical and imaging criteria including physiologic perfusion imaging. A large vessel occlusion was defined as occlusion of the internal carotid artery terminus or the middle cerebral artery, either the main stem or the bifurcation branches. The following financial measures were obtained for each patient:
-
Hospital cost—direct cost and total cost, which comprised both direct and indirect costs;
-
Hospital charges;
-
Diagnosis related group (DRG) code used for billing the hospital admission. DRG codes before 2007 are prefixed by CMS (Center for Medicare and Medicaid services) and those after 2007 indicated by the newer MS (Medicare Severity) DRG codes;
-
Total payments received by the hospital for each patient admission;
-
Insurance payer for each payment and hospital admission;
-
Net financial gain or loss for the hospital, calculated as the difference between the total cost and the total reimbursement or payment.
Additionally, the length of stay, discharge destination, in-hospital mortality, comorbid risk factors, and the functional outcomes based on the 90-day modified ranking score (mRS) were recorded. The clinical outcome was defined as favorable (mRS 0–2) or poor (mRS >2).
All data analysis was performed using JMP statistical software, V.11 (SAS Institute Inc, Cary, North Carolina, USA). The significance of simple bivariate associations was assessed using Fisher's exact test for categorical variables, Student's t test for continuous variables, or logistic regression, as appropriate.
Results
A total of 265 patients with a large vessel occlusion were analyzed. Of these, 124 were in the IV and 141 in the EV group. There were 67 (54%) female patients in the IV group and 71 (50%) in the EV group (p=0.5), with a mean age of 74.1 (±13) years and 70.2 (±15) years, respectively (p=0.03). The mean National Institutes of Health Stroke Scale (NIHSS) score was 15.5 (±8) in the IV versus 16.2 (±8) in the EV group (p=0.5).
The most commonly used DRG codes were CMS-14, MS-61, MS-23, MS-62, MS-63, MS-24 and CMS-559 (table 1). An explanation of the DRG codes and the mean payment associated with each for the IV and EV groups is also listed in table 1. The distribution of the payer mix is shown in figure 1. Medicare A was overwhelmingly the main payer for both the EV and the IV groups, with the remainder comprising a heterogeneous mix of less common payers. Figure 2 shows the mean payment associated with each payer. As shown, Medicare A and Medicaid reimbursements were at the lower end for both the IV and EV groups, while Blue Cross was associated with the highest mean payments. The payments by individual payers for each DRG code used in our data are listed in table 2. Again, Medicare A is the main payer for most of the DRG codes.
Distribution of the diagnosis related group (DRG) and the corresponding payments for endovascular (EV) and intravenous (IV) treatments
Mean payments ($) for each DRG code by individual payers

The payer distribution for endovascular therapy (EV) and intravenous thrombolysis (IV): BC (ALL), Blue Cross, CHAMPUS, Civilian Health And Medical Program of the Uniformed Services; COMM INS, Commercial Insurance—WV; DPW-WV, Department of Public Works—WV; HMO, Health Maintenance Organization; MC A, Medicare Part A; MC HMO, Medicare-HMO; PEIA, Public Employees Insurance Agency—WV; PMA, Pennsylvania Manufacturers’ Association; PVT-PAY, Private Pay.

The payments associated with each payer separated for endovascular therapy (EV) and intravenous thrombolysis (IV). The bars represent the mean payments and the vertical lines represent one SE from the mean: BC (ALL), Blue Cross, CHAMPUS, Civilian Health And Medical Program of the Uniformed Services; COMM INS, Commercial Insurance—WV; DPW-WV, Department of Public Works—WV; HMO, Health Maintenance Organization; MC A, Medicare Part A; MC HMO, Medicare-HMO; PEIA, Public Employees Insurance Agency—WV; PMA, Pennsylvania Manufacturers’ Association; PVT-PAY, Private Pay.
The hospital charges, the total and the direct costs, and the payments were significantly higher for the EV group than for the IV group (figure 3). The figure also shows that the payments for the EV group were higher than the total cost, whereas the payments in the IV group were higher than the direct cost but lower than the total hospital cost (figure 3). The hospital costs were significantly higher for the EV group than the IV group regardless of the in-hospital mortality, clinical outcome, or a home discharge destination (table 3).
The hospital cost amongst endovascular (EV) and intravenous (IV) groups based on in-hospital mortality, clinical outcome, and discharge destination
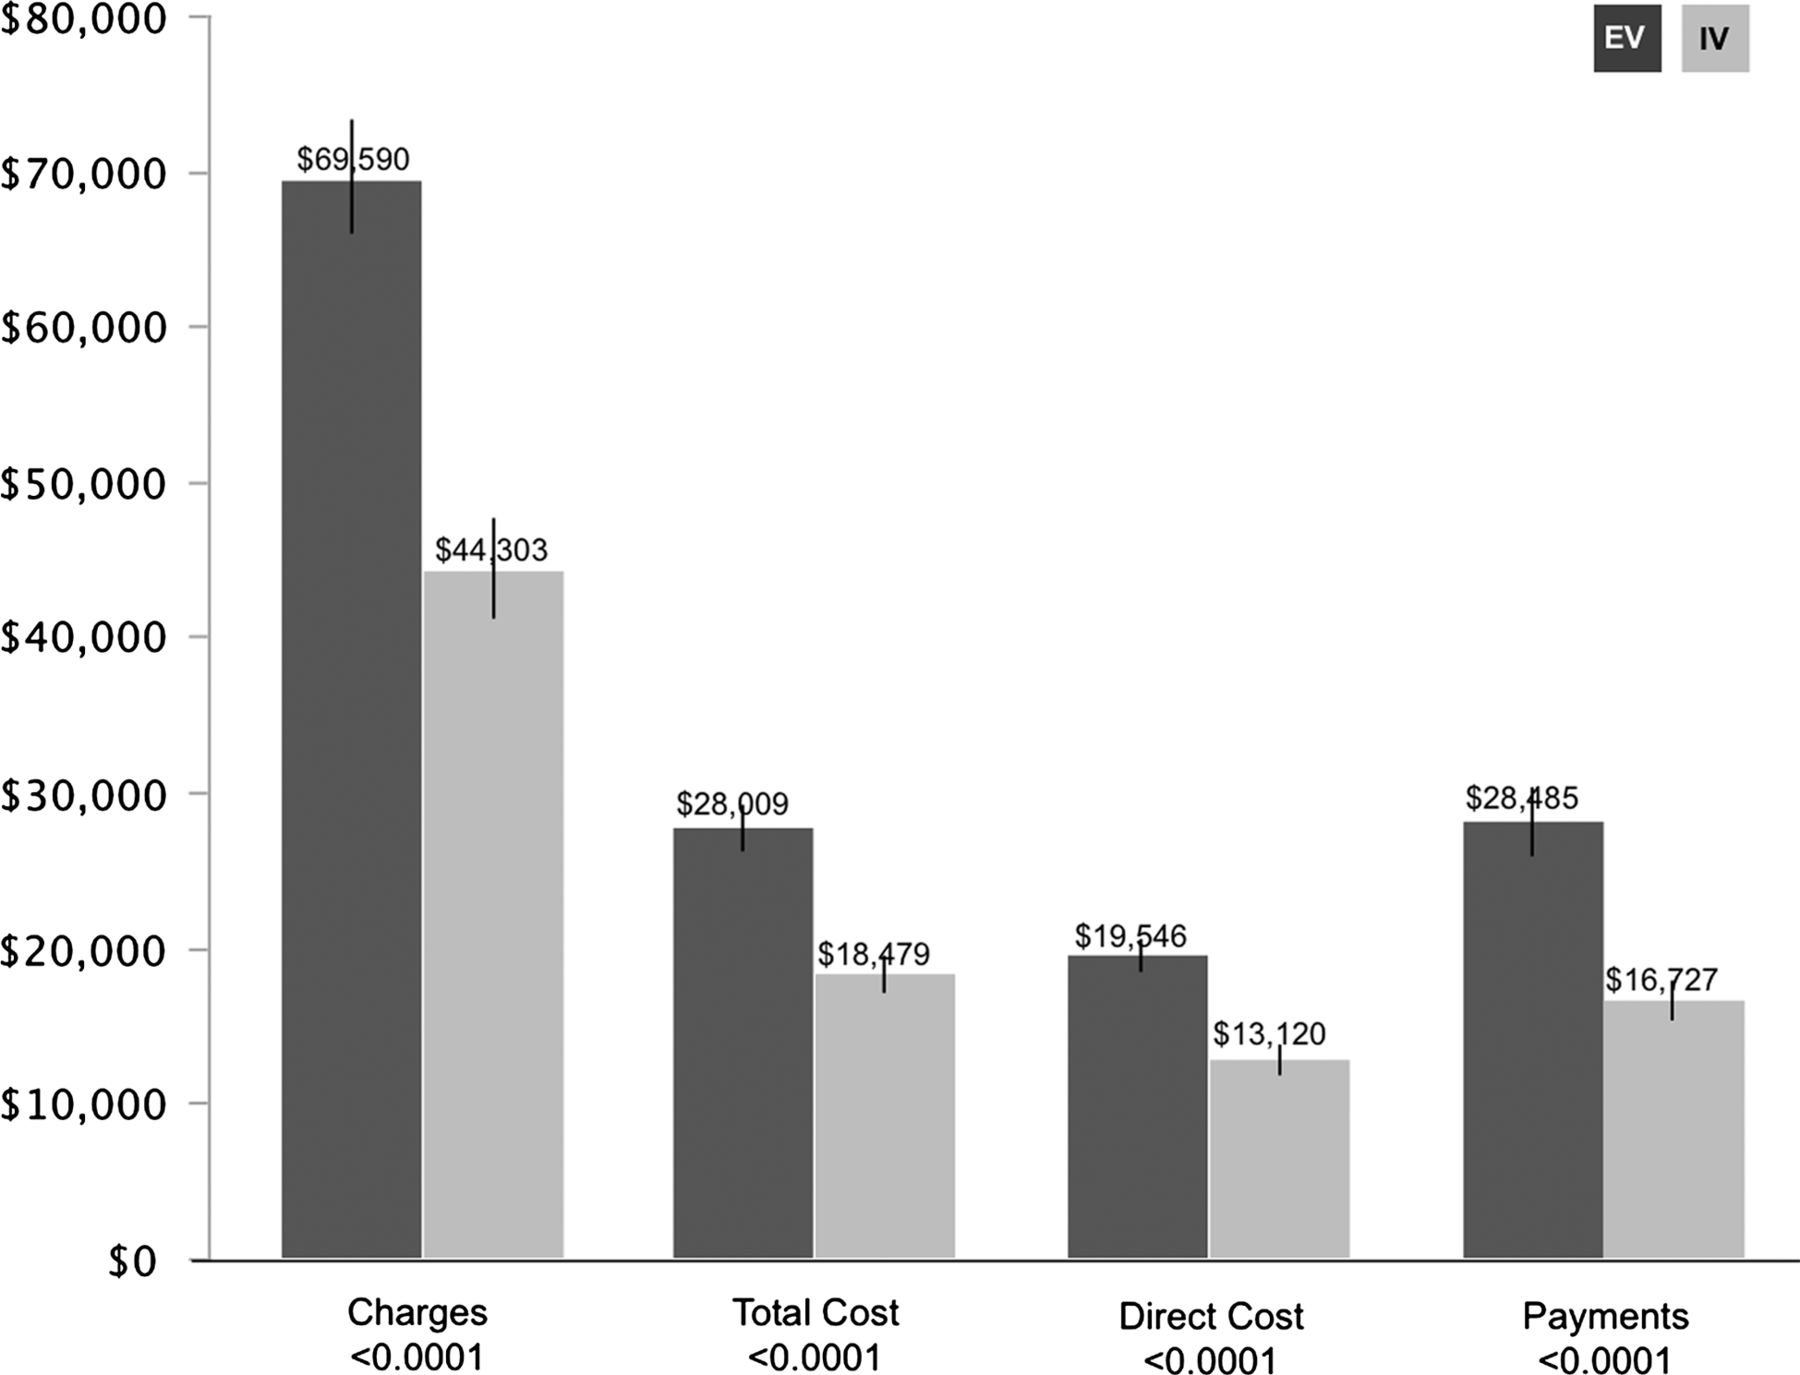
The hospital charges, total cost, direct cost and payments are represented for endovascular therapy (EV) and intravenous thrombolysis (IV). The bars represent the mean payments and the vertical lines represent one SE from the mean.
The hospital had a net financial gain of $476 (±$21 154) for the EV group and a net financial loss of $1752 (±$12 166) for the IV group (p=0.3). There was a significant inverse relationship between financial gain and length of stay (p<0.0001). There was no relationship between financial gain/loss and baseline NIHSS score (p=0.9), patients’ age (p=0.2), or in-hospital mortality (p=0.4). The clinical outcome was significantly associated with the financial outcome. In patients with a favorable outcome, the hospital had a net financial gain of $3853 (±$21 155) as opposed to a financial loss of $2906 (±$15 088) for those with a poor outcome (p=0.003). The length of stay was associated with the clinical outcome for both groups. In the EV group there was a significantly shorter length of stay of 6.9 (±6) days for patients with a favorable outcome compared with 9.6 (±8) days for those with a poor outcome (p=0.03). Similarly, in the IV group the length of stay was 5 (±2.6) days for patients with a favorable outcome as opposed to 8.6 (±8) days for those with a poor outcome (p=0.008). Patients who were discharged home led to a hospital gain of $3113 (±$14 760) as opposed to a financial loss of $1913 (±$18 298) for patients who were discharged to another destination (p=0.04).
Among the stroke risk factors, hypertension and hyperlipidemia had significant correlation with the financial outcome. In hypertensive patients there was a net financial loss of $1665 (±$14 082) as opposed to a gain of $6079 (±$31 616) in those without hypertension (p=0.03). The presence of hyperlipidemia was associated with a net loss of $3526 (±$15 046) compared with a net gain of $2604 (±$20 443) in patients without hyperlipidemia (p=0.01). There was no significant association with other risk factors such as diabetes, atrial fibrillation, and smoking.
The favorable outcome of 42.3% in the EV group was significantly higher than the 29.4% in the IV group (p=0.03). The hospital mortality was 22.7% for the EV and 23.4% for the IV groups (p=0.9) and the length of stay was 8.5 (±7.2) days for the EV group and 7.4 (±6.8) days for the IV group (p=0.2).
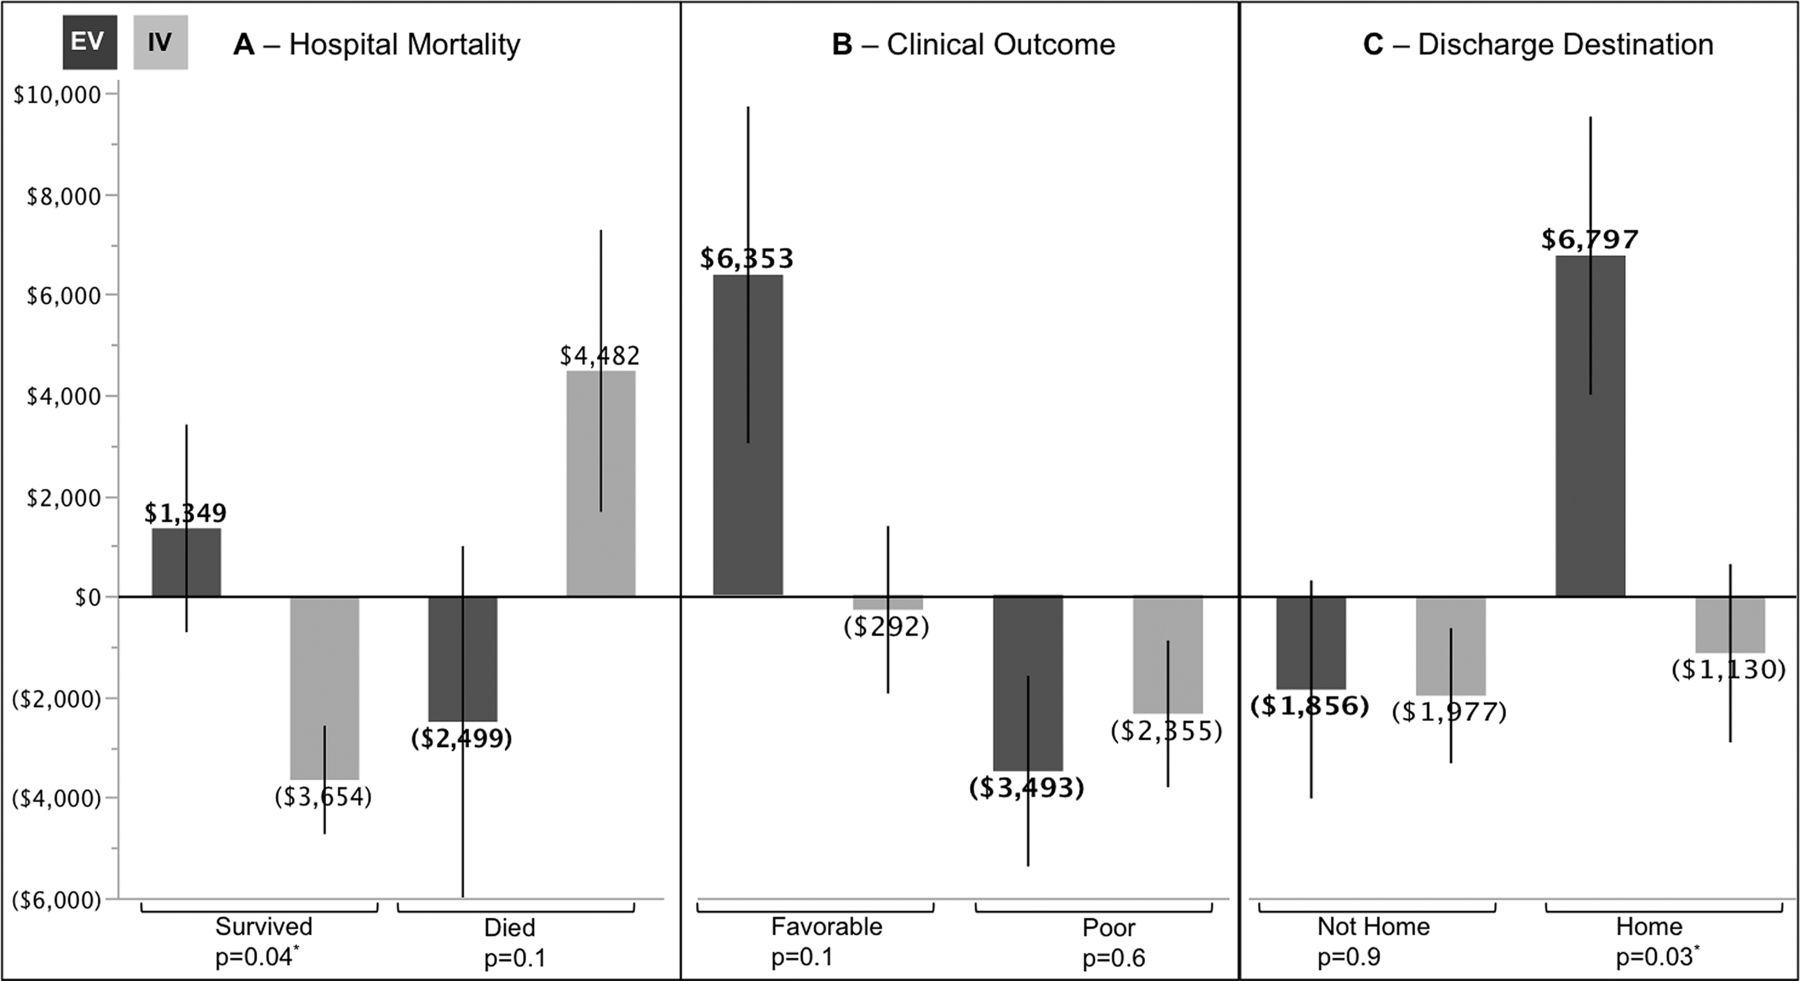
The financial gain/loss was analyzed for the two treatment groups based on in-hospital mortality, clinical outcome, and discharge destination (figure 4). For patients who survived the hospitalization, the hospital had a financial gain for the EV group and a loss for the IV group (p=0.04). The opposite was true for patients who died during their admission. Patients with a favorable outcome tended to result in a financial gain for the hospital in the EV group but not the IV group. A financial loss was seen in patients with a poor outcome regardless of the treatment group. Among patients who were discharged home, there was a significant financial gain for the EV group compared with a financial loss for the IV group (p=0.03). In the EV group, there was no significant difference in the length of stay between patients who died (7.4±8 days) and those who survived (8.9±6.8 days) the hospitalization. Patients in the IV group who died in hospital had a significantly shorter length of stay (5.3±5 days) than those who survived (8±7 days) (p=0.04).

The net financial gain/loss for endovascular therapy (EV) and intravenous thrombolysis (IV) groups based on in-hospital mortality (A), clinical outcome (B), and discharge destination (C). The bars represent the mean payments and the vertical lines represent one SE from the mean. The figures in parentheses represent a net deficit. Among the patients who survived, had a favorable outcome or were discharged to home, the hospital gained financially in the EV group and had a deficit in the IV group. *Significance level is set at 0.05.
Discussion
The 2008 average Medicare payments for MS-DRG 63 (Acute ischemic stroke with use of thrombolytic agent without major complications or comorbidities) was $10 098,7 which is similar to our average payments of $11 522 (table 2). However, our average payment for MS-DRG 61 (Acute ischemic stroke with use of thrombolytic agent with major complications or comorbidities) of $22 024 is higher than the $13 835 reported for 2008.7
A cost analysis based on the national inpatient sample database using hospital charges and the cost–charge ratio by Brinjikji et al projected the median cost of EV therapy as $44 231 for men.8 This is much higher than our mean cost of $28 009. The Medicare part A mean payment in our data of $23 492 (figure 2) will result in a deficit of about $4000 for the hospital as opposed to a much larger deficit reported in their analysis.8 The payer mix has a significant bearing on a hospital's bottom line. Had our population been 100% Medicare, then the hospital, on average, would have lost $4067 for EV and $2688 for IV therapy for each patient. The heterogeneity of our payer mix reflects the financial complexities facing a tertiary level hospital treating acute stroke. In order for a hospital to sustain delivery of ischemic stroke care (both EV and IV), it requires more generous payers in the mix or a significant reduction in the cost of that care. We have listed the amounts paid by individual payers for a particular DRG code (table 2); however, this is also dominated by Medicare.
The quality-adjusted life-years (QALYs) and the incremental cost-effectiveness ratio (ICER) are measures of cost-effectiveness. An ICER of <$50 000 per QALY gained indicates cost-effectiveness of a procedure.9 Previous analyses of EV stroke therapy have yielded an ICER of $12 120 for each QALY gained,10 ,11 falling well within the cost-effectiveness ratio. Using reimbursement data from Centers for Medicare and Medicaid Services and specific mechanical thrombectomy DRG codes, Kim et al estimated a cost–effective benefit in additional treatment of large vessel strokes with EV therapy as opposed to IV thrombolysis alone.12 The use of IV thrombolytic therapy for acute ischemic strokes has also been associated with potential cost savings13 ,14; these estimates, however, do not differentiate between stroke subtypes. Large vessel strokes are less responsive to IV thrombolysis,15–17 resulting in a higher morbidity, mortality and poorer outcomes, leading to potentially higher costs.
For our entire cohort, a shorter stay in hospital and favorable outcome were significant predictors of financial gain. This is probably because a favorable outcome was significantly associated with a shorter stay in both the EV and the IV groups compared with those with a poor outcome. Our hospital costs were higher for EV therapy regardless of outcome, mortality, or a home discharge. This is attributable to the higher direct cost of an EV procedure, which includes devices, catheters, anesthesia equipment, and drugs as well as the cost of the angiography room and the support staff. Interestingly, among the group of patients with indications of a clinical benefit —that is, those who survived the admission, were discharged to home, or had a favorable outcome, the hospital had a net gain for the EV group and a net deficit for the IV group. This was despite an overall similar length of stay for the two groups. A likely explanation might be the difference in the extent of skilled care required, such as in the intensive care or step-down units. Significantly more patients had a favorable outcome in the EV than the IV group and these patients would have been less likely to require prolonged intensive care management. Patients with a poor outcome or those not discharged to home were associated with a net deficit regardless of their treatment group, possibly because of prolonged critical care requirements. This is in keeping with previous reports of the higher cost of care among patients with a poor clinical outcome for both EV therapy8 and IV thrombolysis.7
The financial gain/loss based on in-hospital mortality for the two treatment groups (figure 4A) is interesting. Among those who survived hospitalization, the hospital gained financially for the EV patients but showed a loss for the IV group. The opposite was true for those who died in hospital —that is, a financial gain for the IV group and a loss for the EV group. The explanation may lie in the length of stay. In our data, patients who died in the IV group had a significantly shorter length of stay than those who survived, whereas the length of stay was the same in the EV group regardless of in-hospital mortality. As length of stay had a significant inverse relationship with financial gain/loss, it is safe to assume that the lower cost and hence the associated financial gain among IV patients who died was because of their shorter hospital stay. The financial loss amongst IV group patients who survived the admission might be due to the longer length of stay, and a higher rate of poor outcome—both predictors of higher cost. A higher morbidity and mortality among patients with large vessel strokes treated with IV thrombolysis corroborates this explanation.15 ,17–19
Limitations
Our report primarily reflects the financial data from a single hospital designated as an academic, rural tertiary-level institution. A hospital's cost–charge ratio and reimbursement is affected by these classifications and geography and thus may not be universally applicable. We also do not present a true cost-effective analysis, which requires a more thorough modeling based on clinical outcome, quality-of-life indicators and long-term clinical benefits as well as cost savings associated with a particular treatment. We have a diverse payer mix, albeit dominated by Medicare; this together with the wide variety of DRG codes used is not optimal for evaluating the financial impact of one particular DRG code or payer.
Conclusion
Our results reflect an academic hospital's financial perspective based on providing IV thrombolysis and EV stroke therapy for over a decade. Our financial comparison between treatments is also focused on a specific patient group —that is, those with large vessel strokes. In this group, EV therapy is associated with a higher rate of favorable outcome. Among patients with indicators of clinical recovery —that is, favorable outcome, surviving the hospitalization and a home discharge our hospital showed a financial benefit for EV treatment compared with the net deficit associated with IV thrombolysis. It is becoming increasingly apparent that it is important to recognize large vessel strokes as a distinct clinical diagnosis separate from the all-encompassing diagnosis of ischemic stroke. Only then can we truly assess the effect of a particular treatment on outcomes or healthcare cost.
References
Footnotes
-
Contributors KE contributed to data collection for the study. ATR contributed to study design, analysis, and manuscript preparation for the study.
-
Competing interests None.
-
Ethics approval Institutional review board.
-
Provenance and peer review Not commissioned; externally peer reviewed.