Article Text

Abstract
Background Rates of durable aneurysm occlusion following coil embolization vary widely, and a better understanding of coil mass mechanics is desired. The goal of this study is to evaluate the impact of packing density and coil uniformity on aneurysm permeability.
Methods Aneurysm models were coiled using either Guglielmi detachable coils or Target coils. The permeability was assessed by taking the ratio of microspheres passing through the coil mass to those in the working fluid. Aneurysms containing coil masses were sectioned for image analysis to determine surface area fraction and coil uniformity.
Results All aneurysms were coiled to a packing density of at least 27%. Packing density, surface area fraction of the dome and neck, and uniformity of the dome were significantly correlated (p<0.05). Hence, multivariate principal components-based partial least squares regression models were used to predict permeability. Similar loading vectors were obtained for packing and uniformity measures. Coil mass permeability was modeled better with the inclusion of packing and uniformity measures of the dome (r2=0.73) than with packing density alone (r2=0.45). The analysis indicates the importance of including a uniformity measure for coil distribution in the dome along with packing measures.
Conclusions A densely packed aneurysm with a high degree of coil mass uniformity will reduce permeability.
- Aneurysm
- Coil
- Intervention
This is an Open Access article distributed in accordance with the Creative Commons Attribution Non Commercial (CC BY-NC 4.0) license, which permits others to distribute, remix, adapt, build upon this work non-commercially, and license their derivative works on different terms, provided the original work is properly cited and the use is non-commercial. See: http://creativecommons.org/licenses/by-nc/4.0/
Statistics from Altmetric.com
Introduction
Endovascular coil embolization has emerged as the gold standard for treatment of intracranial aneurysms.1 ,2 The current standard of optimal endovascular treatment of intracranial aneurysms is based on achieving angiographic occlusion and high packing density (PD) in order to achieve a durable exclusion of the aneurysmal sac from the cerebral circulation.3 ,4 The goal of endovascular coil embolization is to reduce the flow of the aneurysm, which varies with coil properties such as permeability and therefore results in thrombus formation, exclusion from circulation, and a decreased risk of rupture.5
Studies have shown that increasing PD resulted in lower intra-aneurysmal velocities and less fluid flow across the aneurysm.6–8 Although an inverse relationship between PD and coil permeability has been observed, the PD of the coil mass may not be the only factor influencing its permeability.
Previous work on modeling the interactions between the coils within an aneurysm with the hemodynamic stress suggested that a coil mass at a given PD with low permeability may accelerate intra-aneurysmal thrombosis due to the drastic reduction in intra-aneurysmal velocities and increased residence times.5 A possible explanation for the variation in permeability at a given PD may be the differences in spatial distribution of the coil mass within the aneurysm.9
The goal of this study is to investigate the effects of both coil PD and spatial uniformity on aneurysm permeability. We have devised a repeatable in vitro assessment tool to objectively measure the coil uniformity in addition to the standard benchmark of PD. We hypothesized that coil permeability is influenced by a combination of PD and uniformity.
Methods
Aneurysm model and coiling procedure
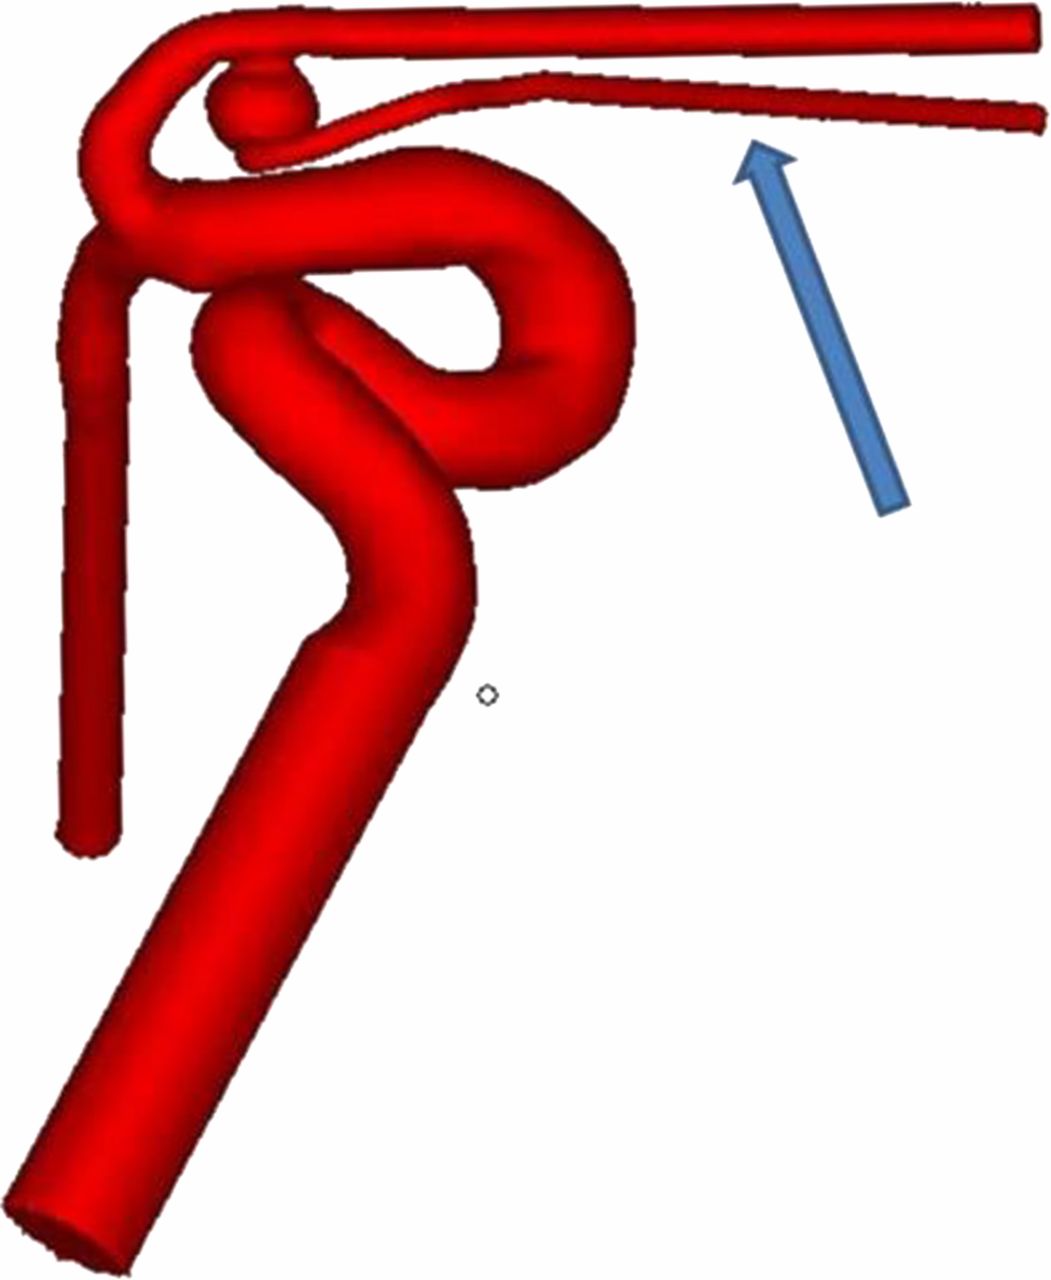
Patient-specific A1 silicone aneurysms (5 mm dome, 3 mm neck, 2 mm parent vessel diameter), shown in figure 1, were prepared using a previously described technique.10 We incorporated a 1.5 mm channel emanating from the aneurysm dome for permeability assessment (blue arrow in figure 1). Prior to aneurysm coiling, the aneurysm volume was calculated by measuring the volume of water needed to fill the aneurysm sac.

Computer model of the A1 aneurysm. The blue arrow indicates the channel which emanates from the aneurysm dome.
Silicone aneurysm models were packed by using Guglielmi detachable coils (GDC, n=8) or Target coils (n=8) (Stryker Neurovascular, Fremont, California, USA). Using an Excelsior SL10 (Stryker Neurovascular), the GDC group was framed with a 5×9 mm GDC 360° detachable coil and finished using only GDC detachable coils. In the Target group, aneurysms were coiled using the standard Target 5×15 mm framing coils and were filled and finished with Target detachable and Target nano coils, respectively. The actual type, size, and number of coils used for both groups were determined by the operator's preference. The coiling procedure was terminated after achieving the procedural end points—namely, complete aneurysm obliteration, catheter dislodgement from the aneurysm, or herniation of coil loops into the parent artery.11
The number, size, and type of coils were recorded for each case and this information was used to calculate the PD of the aneurysm using AngioCalc (http://www.angiocalc.com). The PD was determined by dividing the coil volume by the total volume of the aneurysm.
Permeability assessment
Coil permeability was obtained by evaluating the ability of fluorescent microspheres to pass through the coil mass. Neutrally buoyant fluorescent microspheres of 1 µm that approximate the size of platelets were used in this study. Spheres of this size and specific gravity are often used for hemodynamic measurements in vitro.12 ,13 Calibration curves were established to convert the recorded fluorescent intensities into microsphere concentration.14
The fluorescent microsphere solution was prepared by mixing 1 µm (5×10⁶ microspheres/mL) fluorescent microspheres (Invitrogen FluroSpheres, Eugene, Oregon, USA) in a mixture of 0.15 M NaCl, 0.05% Tween 20, and 0.02% thimerosal. The coiled aneurysm was connected to the flow loop filled with the fluorescent microsphere solution. The channel emanating from the aneurysm dome was open to allow the microspheres to pass through for collection. The fluorescent intensity/concentration of the collected sample was recorded and normalized against the intensity/concentration of the stock solution.
Aneurysm embedding and sectioning
Aneurysms were embedded in a low viscosity epoxy embedding medium, Spurr's Resin (SPI Supplies/Structure Probe, West Chester, Pennsylvania, USA). Coiled aneurysms were infiltrated with the resin and placed in low pressure to remove air trapped in the model. The model was cured, allowing the resin to polymerize. Once the model had cured, the silicone was removed from the aneurysm model. One neck and two dome sections were obtained from each aneurysm model using a low speed saw (Buehler, Lake Bluff, Illinois, USA) for a total of three sections. The neck section was cut between the aneurysm dome and parent vessel. The two dome sections were obtained from two vertical cuts perpendicular to the neck of the aneurysm on either side of the center line. Sections were mounted, polished, and rinsed with 2-propanol. Mounted aneurysm sections were imaged using a flat-bed scanner (Canoscan 9950F; Lake Success, New York, USA) and saved for image analysis.
Image analysis
Scanned images of aneurysm sections (figure 2A shows a dome section) were imported into MatLab (MathWorks, Natick, Massachusetts, USA), converted to a binary image (figure 2B), and custom fit with an elliptical mask that was truncated at the neck section (figure 2C) to provide a binary coil segmented image, C (i, j). The mask, M (i, j), is shown in figure 2D. The surface area fraction (SAF) was calculated as shown in Equation 1: 1
1

Image processing of aneurysm 6 (Target) including (A) the scanned image, (B) the binary image, (C) the binary image with elliptical mask adjusted to account for the neck section, and (D) the mask.
Spatial uniformity of binary coil mass segmented images (eg, figure 2C) was determined using the fractal-based heterogeneity measure, lacunarity, represented as Λ. Values of Λ approaching 0 imply spatially uniform distribution of coil mass with minimal gaps. Lacunarity was determined using the FracLac plugin (V.2013April.b6, http://rsbweb.nih.gov/ij/plugins/fraclac/) for ImageJ (V.1.44p, National Institutes of Health). A sliding-box technique with a minimum region of interest of 5×5 pixels was translated by one pixel along i and j directions to determine lacunarity. While various metrics could be used for assessing spatial uniformity, lacunarity was chosen as it is a well-established image analysis metric15–19 that has been applied in numerous studies including application in neuroimaging.20 Further, the ready availability of this analysis tool would permit researchers to conduct similar investigations.
Statistical analysis
The collected data were statistically analyzed using SAS V.9.3 (SAS Institute, Cary, North Carolina, USA). Effects associated with p<0.05 were considered statistically significant. Paired t tests were used to determine if the two dome sections differed in SAF and lacunarity. Statistical tests were conducted to assess whether coil mass permeability, packing, and uniformity measures differed with coil type (GDC vs Target). It should be noted that the term ‘coil type’ used in this paper refers to all the variations between the GDC and the Target coiling systems, including but not limited to length of the framing coil, coil stiffness and configuration, and design of the coil/delivery wire junction. Correlations between PD, SAF, and lacunarity were determined. Multivariate linear regression models were used to predict coil mass permeability as the outcome, with packing and uniformity measures as predictor variables. If the predictor variables exhibited statistically significant correlation, then partial least squares regression using principal components (PC-PLSR) was used for statistical modeling with leave-one-out cross validation for extraction of factors. A linear regression model with coil mass permeability as the dependent variable and PD as the independent variable was used for comparative assessment.
Results
All aneurysms were coiled to a PD of at least 27%. During aneurysm sectioning, five of the 48 sections (3 neck and 2 dome) were damaged and hence the remaining 43 (89.5%) sections (13 neck and 30 dome) were included in the analysis. For the two dome sections from the same aneurysm, the SAF and lacunarity measures were not statistically different (p>0.19, paired t test) and hence were averaged. Where applicable, subscripts N and D are used to denote the neck and dome sections, respectively. Summary statistics for all measured parameters are provided in table 1. Despite relatively high PD, the coil masses exhibited substantial permeability for the microspheres. The paired t test indicated that SAFN and SAFD were statistically different (p<0.001), with the mean being higher for SAFD than SAFN (table 1). Similarly, ΛN and ΛD were statistically different (p<0.001), with the mean being higher for ΛN than ΛD, implying that the coil distribution at the cross-section of the neck was less uniform than in the dome. Independent t tests with the Satterthwaite method for unequal variances indicated that, compared with GDC coils, Target coils had higher PD (p=0.026), higher SAFD (p=0.002), and reduced coil mass permeability (p=0.006). The SAFN, ΛN, and ΛD were not statistically different between GDC and Target coils (p>0.18).
Summary statistics for measured parameters
Statistical modeling
Table 2 summarizes the Pearson correlation coefficients between the packing and uniformity measures.
Pearson correlation coefficient
All variables were significantly correlated with the exception of PD and ΛN. Hence, statistical models using PC-PLSR were used when two or more predictors were included in the model and linear regression was used when only one predictor was included in the model.
Five statistical regression models were considered with coil mass permeability (P) as the outcome variable (Equation 2). Model A assumes that the coil mass permeability is influenced by PD alone and was obtained by linear regression. Since the permeability was statistically different between GDC and Target coils, Model B improves on Model A by accounting for the differing coil types (CT). Model C considers all variables studied as predictors in the regression model, Model D considered the predictors from Model B and the packing and uniformity measures from the dome section, and Model E considered the predictors from Model B and the packing and uniformity measures from the neck section. Thus, Models D and E address the question whether the permeability is better predicted when packing and uniformity measures from either the dome or the neck section are included with the CT and the PD. For all five statistical models the residuals were analyzed and found to satisfy the normality requirement (p>0.07, Shapiro-Wilks test). Wold's variable importance for projection criterion, in conjunction with the scaled and centered parameter estimates, was used to assess whether any of the predictor variables in each PC-PLSR model needed to be excluded. 2
2
Linear regression (Model A) indicated that the PD was a statistically significant predictor (p=0.005), confirming that the PD plays an important role in coil mass permeability. For each PLS-PCR regression (Models B–E), the magnitudes of the model effects loadings or weights are summarized in table 3. For each model, the similar magnitudes of the predictors within that model indicate that all predictors within each model are equally important.
Magnitudes of the model effects loadings or weights
The regression parameter estimates and the percentage variation in coil mass permeability accounted for by the models are summarized in table 4. For each PLS-PCR regression (Models B–E), analysis of variance indicated that the slope, which represents the transformed predictor along the principal component, was statistically significant and different from zero (p<0.0001). The negative parameter estimates for the packing measures (PD, SAFD and SAFN) indicate that denser packing of the aneurysm will reduce coil mass permeability, which is in agreement with current knowledge. The positive parameter estimates for lacunarity (ΛN and ΛD) indicates that reducing gaps or improving spatial uniformity will decrease coil mass permeability. The linear regression model with PD as predictor (Model A) accounted for only 45% of the variation (r2=0.449) in the measured permeability. Addition of coil type (CT) in Model B better accounted for the variation in coil mass permeability. The CT parameter estimates are denoted with a ‘±’ symbol, indicating that the estimate is positive for the GDC coil and negative for the Target coil. This implies that, when the aneurysms are coiled to the same PD, Target coils reduce permeability compared with GDC coils.
Parameter estimates for the five statistical models
Of the three statistical models that considered measurements from the dome and neck sections, Model D incorporating measurements from the dome section (SAFD and ΛD) along with PD and CT best explained the variation in permeability (r2=0.735). This implies that the dome of the aneurysm needs to be densely and uniformly packed for reducing permeability. Interestingly, the percentage variation in permeability accounted for by Model E, which considered measurements from the neck section (SAFN and ΛN) along with PD and CT, was not better than Model B which included PD and CT. Plots of the measured versus the predicted permeability for four of the models (B–E) are shown in figure 3 to aid in visual comparison. Model A was not included in the plot for clarity and because the coil type used for embolization is always known. The solid lines represent the linear fits to the data and are color coded to match the symbols. Among the four models, the slope of Model D is closest to the identity line (dashes). Table 5 summarizes the slope and intercept determined from the five models. Only Model D exhibited a slope with 95% CI spanning one and an intercept with 95% CI spanning zero, indicating good agreement between measured and predicted permeability.
Slope and intercept values

Measured permeability plotted against the permeability predicted by the models. The solid lines are linear fit to the data and are color coded to match the symbols.
Discussion
The goal of endovascular embolization is to prevent aneurysm growth and rupture by decreasing the intra-aneurysmal blood flow.5 ,11 Using a patient-specific aneurysm model, the effect of PD, coil uniformity, and neck coverage on aneurysm permeability was observed. Although previous literature indicated that higher PDs result in lower intra-aneurysmal velocities and higher occurrences of stagnation,7 the study demonstrated that the permeability was influenced equally by uniformity and PD, as observed by similar loading factors or weights in table 3. This implies that PD alone may not necessarily be an accurate predictor of aneurysm exclusion from coiling.
In previous studies, fluorescent microspheres were used to estimate regional perfusion and blood flow.21 ,22 The concept was extended to the investigation of aneurysm permeability in this study. The size of the microspheres (1 µm) used in this study was smaller than the pore size of the coiled aneurysm23 and of similar size to platelets (3 µm). Therefore, the microspheres did not disrupt the coil mass or block the flow through the aneurysm. Although the described technique was useful for studying coil mass permeability, intra-aneurysmal thrombosis in response to the coil mass was not modeled in this in vitro experiment. Importantly, our study to measure coil mass permeability required an outlet, and therefore a pressure drop, across the aneurysm dome. The permeability measurements were therefore obtained in an idealized worst-case model system that is not representative of true intra-aneurysmal flow conditions. However, this design allows us to reproducibly study coil mass resistance to flow and to study the coil mass characteristics that are involved in reducing permeability.
The coil mass within the aneurysm acts as a porous medium, with voids in the coil mass creating channels for fluid travel. With a higher coil PD, the tortuosity—or weighted ratio of the length a fluid must travel to move across the media to the length of the media—increases. Because the porosity of a coiled aneurysm is imperfect, tortuosity cannot be assumed to be consistent throughout the aneurysm, supporting the idea that PD alone is not adequate for predicting treatment efficiency. When local porosity and tortuosity within an aneurysm (ie, of individual volumetric nodes) are considered, it becomes clear that the uniformity of the coil mass distribution will have an effect on the range of local porosities observed. Thus, in order to maximize tortuosity—and maximize residence times as a result—the porosity range should be minimized and PD maximized. The range of local porosities can be minimized by taking care to ensure uniform distribution of the coil within the aneurysm is achieved.
Clinical implications of this study may include achieving a higher PD, and coil mass uniformity may be inversely related to the rate of aneurysm recurrence or coil compaction. A higher PD and uniform coil construct reduce aneurysm permeability, resulting in rapid exclusion of the aneurysm from the circulation. In this study a single operator coiled all the aneurysms, and thus dependence of homogeneity of the coil mass on the operator or technique cannot be assessed. However, two different coil types were used and we found that, compared with GDC coils, Target coils reduced coil mass permeability, primarily by improving packing measures (PD and SAFD). The improved packing measures observed in the Target group may be expected because of the use of the longer framing coil, which is a limitation of this study. Since there is an upper bound to PD before coil herniation into the parent artery or catheter dislodgement occurs, our study indicates that designing coils to improve spatial distribution uniformity is a potential avenue for reducing aneurysm permeability.
This study presents a bench-top method to rigorously study coil uniformity and its impact on permeability. The selected aneurysm dimensions were based on our clinical database, which shows a mean diameter for coiled aneurysms of approximately 5 mm. This relatively small diameter is probably the result of numerous small ruptured aneurysms that are coiled as well as a shift for larger aneurysms to be treated with flow diverters. Future work should consider larger aneurysm models as well as other commercially available coils being specifically designed for large aneurysms.24 Also under development are methods to reduce coil mass artifacts on 3D imaging.25 ,26 These techniques may ultimately lead to assessment of coil mass distribution using minimally invasive or non-invasive imaging modalities. However, until these developments are realized, bench-top experimentation can serve to provide feedback into the coil development process to produce coil technology that considers spatial distribution as a design input.
Conclusions
The results of this study reinforce the prior knowledge that PD influences coil mass permeability, with higher PD resulting in lower permeability. Importantly, the study showed that achieving spatially uniform distribution of coil mass with minimal gaps in the aneurysm dome is equally important in reducing coil mass permeability. A model incorporating PD, SAF of the dome section, and a spatial heterogeneity measure (lacunarity) of the dome section predicted coil mass permeability better than a model with PD alone. This study shows that uniformity and packing measures collectively and equally influence permeability.
References
Footnotes
J-YC and SV contributed equally.
Contributors J-YC, SV, AKW, SLC and MJG: conception and design. CB and SC: literature research. J-YC, SV, CB and MJG: statistical analysis and drafting the manuscript. All authors were involved in acquisition of data, analysis and interpretation of data, critical revision of the manuscript and approval of the final manuscript.
Funding This work was supported by Stryker Neurovascular. The content is solely the responsibility of the authors and does not represent the official views of Stryker. Abridged contents of this work have been accepted as a conference abstract at the 7th Word Congress of Biomechanics.
Competing interests None.
Provenance and peer review Not commissioned; externally peer reviewed.