Article Text

Abstract
Background While clinical and angiographic risk factors for intracranial aneurysm instability are well established, it is reasonable to postulate that intra-aneurysmal hemodynamics also have a role in aneurysm instability.
Objective To identify hemodynamic characteristics that differ between radiologically unstable and stable unruptured intracranial aneurysms.
Materials and methods 12 pairs of unruptured intracranial aneurysms with a 3D rotational angiographic set of images and followed up longitudinally without treatment were studied. Each pair consisted of one stable aneurysm (no change on serial imaging) and one unstable aneurysm (demonstrated growth of at least 1 mm diameter or ruptured during follow-up) of matching size (within 10%) and locations. Patient-specific computational fluid dynamics models were created and run under pulsatile flow conditions. Relevant hemodynamic and geometric variables were calculated and compared between groups using the paired Wilcoxon test.
Results The area of the aneurysm under low wall shear stress (low shear stress area (LSA)) was 2.26 times larger in unstable aneurysms than in stable aneurysms (p=0.0499). The mean aneurysm vorticity was smaller by a factor of 0.57 in unstable aneurysms compared with stable aneurysms (p=0.0499). No statistically significant differences in geometric variables or shape indices were found.
Conclusions This pilot study suggests there may be hemodynamic differences between unstable and stable unruptured cerebral aneurysms. In particular, the area under low wall shear stress was larger in unstable aneurysms. These findings should be considered tentative until confirmed by future larger studies.
- Aneurysm
- Subarachnoid
Statistics from Altmetric.com
Introduction
Longitudinal and cross-sectional studies of patients with unruptured and ruptured aneurysms have demonstrated a number of clinical and angiographic variables associated with aneurysm growth and rupture.1–4 The most well-established risk factor for aneurysm growth and rupture is aneurysm size, as larger aneurysms are more prone to rupture than small aneurysms. However, a majority of ruptured aneurysms are small, thus limiting the clinical applicability of this finding. Aneurysm location is another variable associated with rupture, as aneurysms located at bifurcation points, such as the basilar tip, middle cerebral artery, and anterior cerebral artery/anterior communicating artery, are known to have higher rupture risk than aneurysms at other locations. Clinical variables associated with aneurysm growth and rupture include patient smoking history, decreasing patient age, family history of subarachnoid hemorrhage, hypertension, and presence of multiple aneurysms.5–7
While clinical and angiographic risk factors for aneurysm rupture and growth are well established, it is reasonable to assume that intra-aneurysmal hemodynamics also have a significant role in aneurysm growth and rupture. Computational fluid dynamic models have demonstrated that a number of hemodynamic parameters are associated with aneurysm growth and rupture.8 ,9 In order to study the role of hemodynamic parameters in aneurysm progression, we performed a case–control study examining various computational fluid dynamic (CFD) parameters in two groups of location- and size-matched aneurysms: (1) unruptured aneurysms without evidence of progression at long-term follow-up and (2) unruptured aneurysms with imaging evidence of growth or rupture at follow-up.
Patients and methods
Patient selection
After institutional review board approval, a total of 24 patients with unruptured aneurysms with serial imaging follow-up at a single site were included in this study. A total of 300 aneurysms which had received DSA between January 2009 and December 2013 were screened, producing 12 matching pairs. In these multiple matched pairs, we included only stable aneurysms with the longest follow-up. Aneurysms were matched by location and size. For the size matching, the size difference between matched pairs had to be within 10% (eg, 4 mm aneurysms could be matched with an aneurysm ranging from 3.6 to 4.4 mm). Inclusion criteria were the following: (1) at least one baseline 3D rotational angiographic set of images, (2) serial imaging of the aneurysm with either CT angiography, MR angiography, or conventional angiography, and (3) growth of the aneurysm on imaging follow-up or documented stability of the aneurysm with serial intracranial vascular imaging, with the first and last 3D rotational angiographic images spaced at least 12 months apart. Aneurysms that presented as ruptured and those lacking serial imaging were excluded from this study.
Patient groups and imaging assessment
Patients/aneurysms were divided into two groups: (1) stable aneurysms defined as unruptured aneurysms without documented evidence of growth or rupture on follow-up imaging (at least 12 months apart) and (2) unstable aneurysms defined as unruptured aneurysms with evidence of growth or rupture on follow-up imaging. Aneurysm growth was defined as increase in aneurysm size of at least 1.0 mm in maximum dimension on cross-sectional or angiographic imaging. All images were interpreted by one neuroradiologist.
In addition to aneurysm size, location, and stability, the following data were collected: age at diagnosis, sex, current tobacco use, family history of aneurysm or subarachnoid hemorrhage (SAH), personal history of SAH, and race (white non-Finnish, Hispanic, Black, Japanese, and Finnish). The PHASES score was calculated for each patient/aneurysm.5 ,6
Aneurysm modeling
The methods used for aneurysm modeling have been described previously by Cebral et al.10 Patient-specific vascular models were constructed from the 3D images obtained at the initial examination. Segmentation was carried out using region growing and deformable models.10 Models were smoothed and truncated perpendicularly to the vessel axis, keeping as much of the proximal parent artery as possible to ensure proper representation of secondary swirling flows in the parent artery and aneurysm orifice.11 Unstructured grids were generated with a resolution of 0.2 mm. Blood was approximated as a Newtonian fluid with density ρ=1.0 g/cm3 and viscosity μ=0.04 Poise. The incompressible Navier–Stokes equations were numerically solved using in-house finite elements solver. Pulsatile flow boundary conditions were imposed at the model inlet using the Womersley profile. The flow waveform was derived from phase-contrast MR measurements in the internal carotid artery and vertebral artery of normal subjects12 and scaled with the inlet boundary area.13 Inlet boundaries were the internal carotid artery for anterior circulation aneurysms and the vertebral arteries for posterior circulation aneurysms. The flow from the parent artery was split among the outlet boundaries according to the principle of minimum work (Murray's law).14 Wall compliance was neglected and no-slip boundary conditions were applied at the walls. Numerical simulations were carried out for two cardiac cycles and the flow field was saved at 0.01 s intervals during the second cycle for subsequent analysis.
Hemodynamic analysis
Aneurysm necks were delineated on the reconstructed models. A few points on the neck were interactively selected and connected along lines of minimum geodesic distance. Next, the aneurysm orifice was triangulated and used to subdivide the computational mesh into two regions corresponding to the aneurysm and the parent artery. A number of flow variables defined on the aneurysm surface, volume, or orifice were quantified and used to characterize the aneurysm hemodynamics. Volumetric factors included: mean aneurysm kinetic energy; mean aneurysm velocity; mean aneurysm shear rate (a measure of the deformation of the fluid elements); mean aneurysm vorticity (VO) (a measure of the rotational velocity of fluid elements); mean aneurysm viscous dissipation; and vortex coreline length (corelen), which provides a measure of the complexity of the aneurysmal flow structure.15 Surface factors included mean, maximum, and minimum wall shear stress (WSS, WSSMAX, WSSMIN) computed over the aneurysm sac; shear concentration index, which measures the degree of concentration of the WSS distribution; percentage of the aneurysm area under low WSS (LSA), where low WSS is defined as 1 SD below the mean WSS in the parent artery; and mean oscillatory shear index. Hemodynamic factors defined over the aneurysm orifice included mean inflow rate and inflow concentration index, which measures the degree of concentration of the inflow stream. Additionally, a number of geometric variables were calculated, including aneurysm size (maximum distance between two points on the dome); aneurysm depth (maximum distance from the aneurysm dome to the orifice); maximum neck size; aneurysm area; neck area; and aspect ratio. More details and exact definitions of these variables are provided by Mut et al.16
Statistical analysis
Mean values of hemodynamics and geometric variables over the growing and stable aneurysm groups were calculated and compared. Non-parametric paired Wilcoxon rank sum tests were performed to determine the statistical significance of the hemodynamic differences between growing and stable aneurysms. We performed a subgroup analysis of aneurysms of ≤7 mm to determine if any differences could be detected in this subset. When comparing baseline clinical data, Student's t test was used for comparison of continuous variables and a χ2 test was used for comparison of categorical variables. Differences were considered statistically significant if the two-tailed p values were <0.05 (95% confidence).
Results
Patient and aneurysm characteristics
A total of 24 patient-aneurysms were included in this study. Twelve were in the stable group and 12 in the unstable group. Mean±SD patient age in the stable and unstable groups were 66.2±14.6 vs 65.4±9.2, respectively (p=0.88). There was no difference in sex distribution (p=0.14), race distribution (p=0.25), hypertension status (p=0.41), family history (p=0.27), or history of SAH (p=0.54) between groups. Mean aneurysm size was 7.3±4.4 mm in the stable group and 7.6±4.1 mm in the unstable group (p=0.89). There was no difference in aneurysm location between the groups (p=1.00). This confirms an adequate matching of aneurysm pairs by size and location. Mean±SD PHASES score was 5.7±2.0 in the stable group and 5.1±2.1 in the unstable group (p=0.49). These data are summarized in table 1.
Patient and aneurysm characteristics
Unstable versus stable aneurysms
The ratios of the mean values of shape, geometric features, and hemodynamics of unstable versus stable aneurysms are provided in figure 1A–B. In these graphs, bars above or below 1 indicate that the mean value of the corresponding variable is on average larger or smaller, respectively, in unstable than in stable unruptured aneurysms and show by how much. Statistically significant differences are indicated by an asterisk by the name of the given variable. There were no statistically significant differences in any of the geometric or shape parameters between the stable and unstable groups (figure 1A). When various hemodynamic parameters were compared between the unstable and stable groups, the area of the aneurysm under low wall shear stress (LSA) was 2.26 times larger in unstable aneurysms than in stable aneurysms (p=0.0499). The mean aneurysm VO was smaller by a factor of 0.57 in unstable aneurysms compared with stable aneurysms (p=0.0499) (table 2; figure 1B). In a subgroup analysis of matched pairs in which both aneurysms measured ≤7 mm (seven pairs, 14 aneurysms), LSA was 2.04 times larger in the unstable group, but this difference was not statistically significant (p=0.13). Mean VO was smaller by a factor of 0.49 in unstable aneurysms, but this difference was also not statistically significant (p=0.18). Representative examples of stable and unstable aneurysms are shown in figures 2⇓–4.
Mean and SD of hemodynamic and geometric variables over the stable and unstable aneurysm groups, and corresponding p values of the paired Wilcoxon test

Graphical representation of hemodynamic parameters in unstable and stable aneurysms. (A) Aneurysm geometry. Avol, aneurysm volume; Asize, aneurysm size; Aarea, aneurysm surface area’ Nsize, aneurysm neck size; Narea, aneurysm neck area; Depth, aneurysm depth; AR, aspect ratio (depth/neck). (B) Aneurysm hemodynamics. corelen, coreline length; ICI, inflow concentration index; KE, kinetic energy; LSA, aneurysm area under low WSS; OSI, oscillatory shear index; SCI, shear concentration index; SR, shear rate; VD, viscous dissipation; VE, velocity; VO, vorticity; WSS, wall shear stress; WSSMAX, maximum wall shear stress; WSSMIN, minimum wall shear stress.
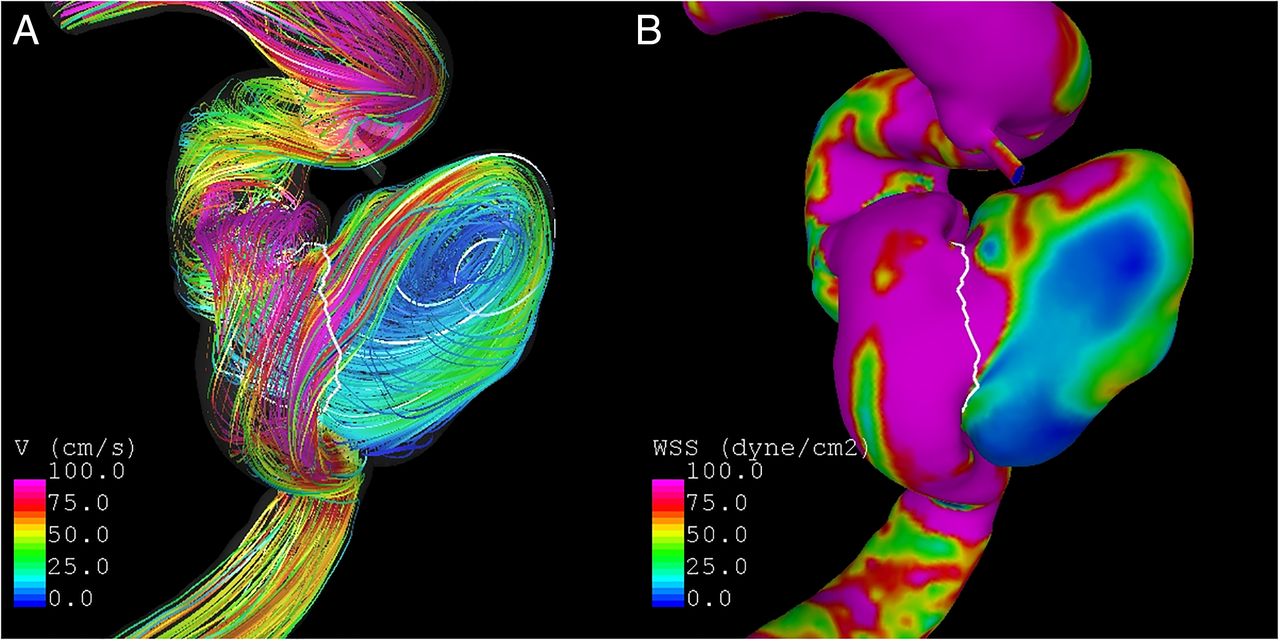
Example of unstable 8 mm cavernous internal carotid artery aneurysm. This aneurysm had grown 2 mm at the 1-year follow-up. (A) Vortex (V) analysis demonstrates a complex vortex structure with two main small vortices. (B) Wall shear stress (WSS) analysis demonstrates heterogeneous wall shear stress with a large area of the aneurysm dome under low shear stress (80% total). There is high wall shear stress of the parent artery due to curvature and tortuosity.

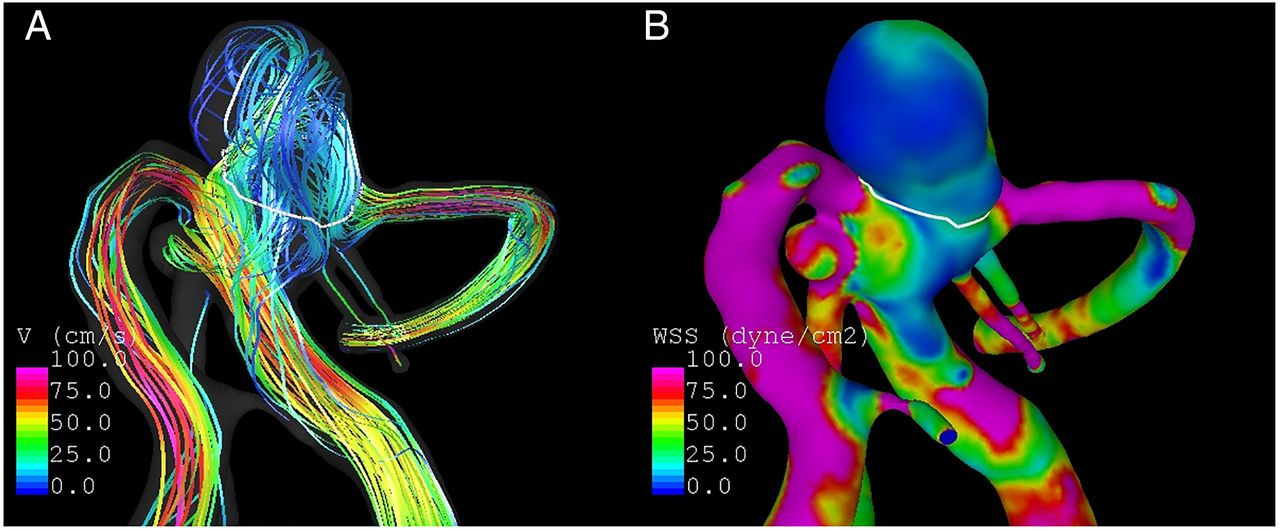
Example of unstable 5 mm basilar tip aneurysm. This aneurysm had grown 1.5 mm at the 1-year follow-up. (A) Vortex (V) analysis demonstrates a complex inflow pattern with two main vortex structures. (B) Wall shear stress (WSS) analysis demonstrates a small region of high wall shear stress at the neck of the aneurysm but a majority of the aneurysm dome (90%) is under low wall shear stress.

Example of stable 5 mm basilar tip aneurysm. This aneurysm was stable at the 2 year follow-up. (A) Vortex (V) analysis demonstrates a single vortex with simple flow through the aneurysm. (B) Wall shear stress (WSS) analysis demonstrates fairly uniform wall shear stress comparable to that of the parent artery. There is an area of low shear stress at the aneurysm bleb; however, the aneurysm remained stable on follow-up.
Discussion
Our size- and location-matched case–control study of 24 stable and unstable aneurysms suggests that there are significant differences in the area of the aneurysm under low WSS and in the mean aneurysm VO between these two groups. Aneurysms that were unstable had a higher area under low WSS and had a smaller mean VO than stable aneurysms. These findings are important as they suggest that CFDs might provide prognostic information about the risk of aneurysm growth or rupture that is independent of aneurysm location and size. In particular, hemodynamics information could augment current risk factors used in the PHASES scale. Ultimately, these results must be confirmed with larger studies with a single a priori hypothesis.
A number of previous studies have examined various CFD parameters associated with aneurysm growth or rupture. Findings related to either low WSS or a high aneurysm area under low WSS have been consistently reported as variables associated with unstable and/or ruptured aneurysms. For example, one previous study of 33 aneurysms found that area under low WSS and WSSMIN was 94% accurate in discriminating between stable and unstable aneurysms.17 In this particular previous study, there was a trend towards higher LSA values in unstable than in stable aneurysms.17 Another study analyzing hemodynamics in seven growing aneurysms found that growth occurs in regions of abnormally low WSS.18 A large study of over 100 ruptured and unruptured aneurysms found that low WSS was independently associated with aneurysm rupture status.19 One recently published meta-analysis studying hemodynamic factors associated with aneurysm rupture found that mean and normalized WSS were significantly lower, and low shear area was significantly higher, in ruptured than in unruptured aneurysms.20 Similar to these studies, our study of 24 aneurysms matched by size and location suggests that a large area under low WSS, independent of size and location, is associated with aneurysm instability.
The presence of low WSS in the aneurysm dome is thought to place the aneurysm at higher risk of growth and rupture because endothelial cells exposed to a low WSS are associated with an elevated oxidative state, undergo increased apoptosis and increased cell turnover, and have a gene expression pattern associated with proinflammatory signal pathways.21–26 Such an inflammatory milieu combined with apoptosis of the endothelial layer can potentially weaken the aneurysm wall and result in future growth or rupture. Based on prior studies, it is difficult to discern whether low WSS is a causal factor for rupture or a post-rupture phenomenon. Our study, and others, point to the hypothesis that low WSS in the aneurysm dome may be one causal factor for rupture and growth as none of the aneurysms that underwent CFD analysis were ruptured at the time of analysis.19 ,20 ,27 High WSS has also been associated with damage to the vascular wall, especially during aneurysm formation, as well as with aneurysm rupture.19 ,27 A large area under low WSS is also consistent with high WSS effects concentrated or focalized in a small area of the aneurysm. The shear concentration index was larger in the unstable group in our study, but this trend did not reach statistical significance.
VO is another factor that was shown to be associated with aneurysm instability in our study. Variables such as VO provide information about the rotation of fluid elements as they are transported with the flow. Prior studies examining aneurysm vortices have found that complex flow patterns and multiple vortices are associated with ruptured aneurysms.28 ,29 Such complex flow patterns are thought to increase inflammatory cell infiltration in the aneurysm wall and could suggest a propensity to develop intrasaccular thrombus. In general, the simple stable flow patterns seen in stable aneurysms are associated with a large vortex, whereas the complex unstable flow patterns in unstable growing and ruptured aneurysms are more likely to result in multiple smaller vortices, as shown in our study. Our study found that unstable aneurysms had a smaller VO value than stable aneurysms, a finding which has yet to be demonstrated in a size- and location-matched case–control study.
Limitations
Our study has some limitations. Although this was a case–control study, in which all aneurysms were matched by size and location, the aneurysms included in this study may still have suffered from selection bias as aneurysms selected for conservative management are often considered less likely to grow or rupture to begin with. Given the minimum follow-up time of 12 months to confirm aneurysm stability, it is possible that some very slowly growing aneurysms were included in the stable group. Owing to the relatively small sample size, our study was probably underpowered to detect smaller differences in various parameters between the stable and unstable groups. Our subgroup analysis of aneurysms of ≤7 mm is also severely limited owing to low power. Furthermore, CFD models make many assumptions, such as rigid aneurysm walls, Newtonian flow, and normal physiologic conditions. The coarse temporal resolution used in these simulations may mask flow instabilities. Finally, we did not correct statistically for multiple comparisons in this exploratory study. If a Bonferroni correction were applied, the significance would be completely lost. Thus, it important for readers to consider these findings cautiously until they are confirmed by larger studies with a single a priori hypothesis.
Conclusions
This pilot study indicates that there may be hemodynamic differences between unstable and stable unruptured cerebral aneurysms that are independent of aneurysm size and location. In particular, the area under low WSS was larger in unstable aneurysms. This result is consistent with previous studies that compared growing and stable17 as well as ruptured and unruptured aneurysms.20 Since the associations with rupture found in our study are independent of size and location, they have the potential to add extra information valuable for assessment of aneurysm risk. These findings should be considered tentative until confirmed by future larger studies.
References
Footnotes
Contributors All authors participated in drafting the article and revising it critically for important intellectual content; made substantial contributions to conception and design, acquisition of data, and analysis and interpretation of data; and provided final approval of the version to be published.
Funding Society of Interventional Radiology Pilot Research Grant.
Competing interests None declared.
Ethics approval Mayo Clinic institutional research board.
Provenance and peer review Not commissioned; externally peer reviewed.
Data sharing statement Please email the corresponding author for data requests.