Article Text

Abstract
Background and purpose MR angiography (MRA) is an increasingly used evaluation method following intracranial stenting. However, the various artifacts created by the stent limit this technique. The purpose of this study was to investigate the effects of various concentrations of gadolinium contrast agent on the visibility and signal characteristics of two stents using the a contrast enhanced MRA technique.
Material and method Two intracranial stents (Enterprise and Helistent) were placed in polyvinyl chloride tubes as vascular phantoms. They were filled with six different doses of gadolinium contrast agent (1.0, 2.0, 4.0, 6.0, 8.0, and 10.0 mmol/L dimeglumine gadopentetate, respectively) and imaged using 3 T and 1.5 T MR systems. Relative in-stent signal (RIS) was calculated and artificial luminal narrowing (ALN) was obtained using pixel by pixel analysis.
Result The Enterprise stent, performed in both 1.5 T and 3 T MR systems, showed mean RIS values much less than those for the Helistent for all different doses of gadolinium solution. Increased gadolinium concentration resulted in a gradual reduction in RIS values in the Enterprise group. Also, ALN in the Enterprise group showed no or little change with various gadolinium doses.
Conclusions The Enterprise stent demonstrated good luminal visibility regardless of gadolinium concentration. The relative in-stent signals were more predictable in the Enterprise stent with various doses of gadolinium. Therefore, the Enterprise stent has been shown to provide better in-stent visibility compared with the Helistent using various gadolinium doses.
- Magnetic Resonance Angiography
- Stent
Statistics from Altmetric.com
Introduction
Intracranial stent placement is used for treating either severe arterial stenosis, less severe but clinically symptomatic arterial stenosis, or assisting coil embolization in wide neck aneurysms. Transfemoral cerebral arteriography is considered the gold standard for visualization of in-stent patency. However, it is associated with various complications due to its invasive nature1 and limited by its need for hospitalization. MR angiography (MRA) is an increasingly used method for evaluation of stented vessel segments due to its non-invasive and time conserving nature. However, different stents create various artifacts and limit this technique.
In this study, our aim was to investigate whether varying doses of gadolinium contrast agent improve the visualization of the in-stent patency with our in vitro models. To our knowledge, this is the first study that has investigated the relationship between different concentrations of gadolinium and their effects on visualization of stented vessels in vitro.
Material and methods
Phantom design
Our study was performed in vitro using a static phantom design. An Enterprise stent (4.5 mm/22 mm; Codman & Shurtleff, Raynham, Massachusetts, USA) was chosen based on previous studies which showed that a nitinol stent generally created fewer artifacts than a stainless steel or a cobalt stent,2–4 and that it is one of the few true intracranial stents. Its primary use is to assist coiling for wide neck aneurysms but it can also be used for treatment of intracranial atherosclerotic stenosis as an off-label use.5–7 A Helistent (4.0 mm/16 mm; Hexacath, Rueil-Malmaison, France) was chosen as the comparison group due to its stainless steel nature and it was used intracranially before the introduction of intracranial stents for the treatment of intracranial atherosclerosis.
The Enterprise stent was placed in the center of a vessel-like polyvinyl chloride tube with an outer diameter of 6.5 mm, inner diameter of 4.5 mm, and length of 100 mm to create a vascular phantom. The Helistent was placed in the tube with an outer diameter of 4.3 mm, inner diameter of 3.8 mm, and length of 100 mm. Both vascular phantoms were anchored in a rectangular plastic box parallel to each other during scanning. Six types of solutions were prepared and injected into the vascular phantoms: concentrations of 1.0, 2.0, 4.0, 6.0, 8.0, and 10.0 mmol/L dimeglumine gadopentetate (Magnevist; 0.5 mmol/mL; Bayer) solution (1 L of normal saline solution mixed with 2, 4, 8, 12, 16, and 20 mL of dimeglumine gadopentetate respectively). The vascular phantoms were connected to a tubing device and syringe to prevent positional change of the vascular phantom at each scan with changing of the gadolinium solution. The phantom boxes were then filled with normal saline outside of the vessel-like tubes.
MR imaging
We used 3 T and 1.5 T MR systems to obtain images of the vascular phantoms (Discovery 750 and Optima MR360; GE Healthcare, Milwaukee, Wisconsin, USA). An eight channel head coil was used. The phantom was placed in the center of the coil with the longitudinal axis of the stent parallel to the main magnetic field. The design of contrast enhanced MRA (CEMRA) sequences was based on previous studies and followed these principles3 ,4 ,8: (1) the shortest repetition time (TR) possible to maximize the contrast to noise ratio; (2) the shortest echo time (TE) possible to minimize signal loss due to dephasing; (3) a wide bandwidth was chosen as previous studies showed artifact reduction and improved in-stent luminal visualization9–12; (4) a flip angle of 25° was used as a balance between optimal suppression of static tissues and clinically acceptable scanning time; and (5) isotropic voxel of 0.6×0.6×0.6 mm3 was chosen for its clinical use in three-dimensional reformation. Sequence parameters for 3 T and 1.5 T MR systems are summarized in table 1. A total of 24 MR series were obtained using 3 T and 1.5 T MR systems.
Overview of sequence parameters in the 3 T and 1.5 T MR systems
Image analysis
Coronal images were obtained as source images, and these source data were reconstructed using the maximum intensity projection technique.
Relative in-stent signal
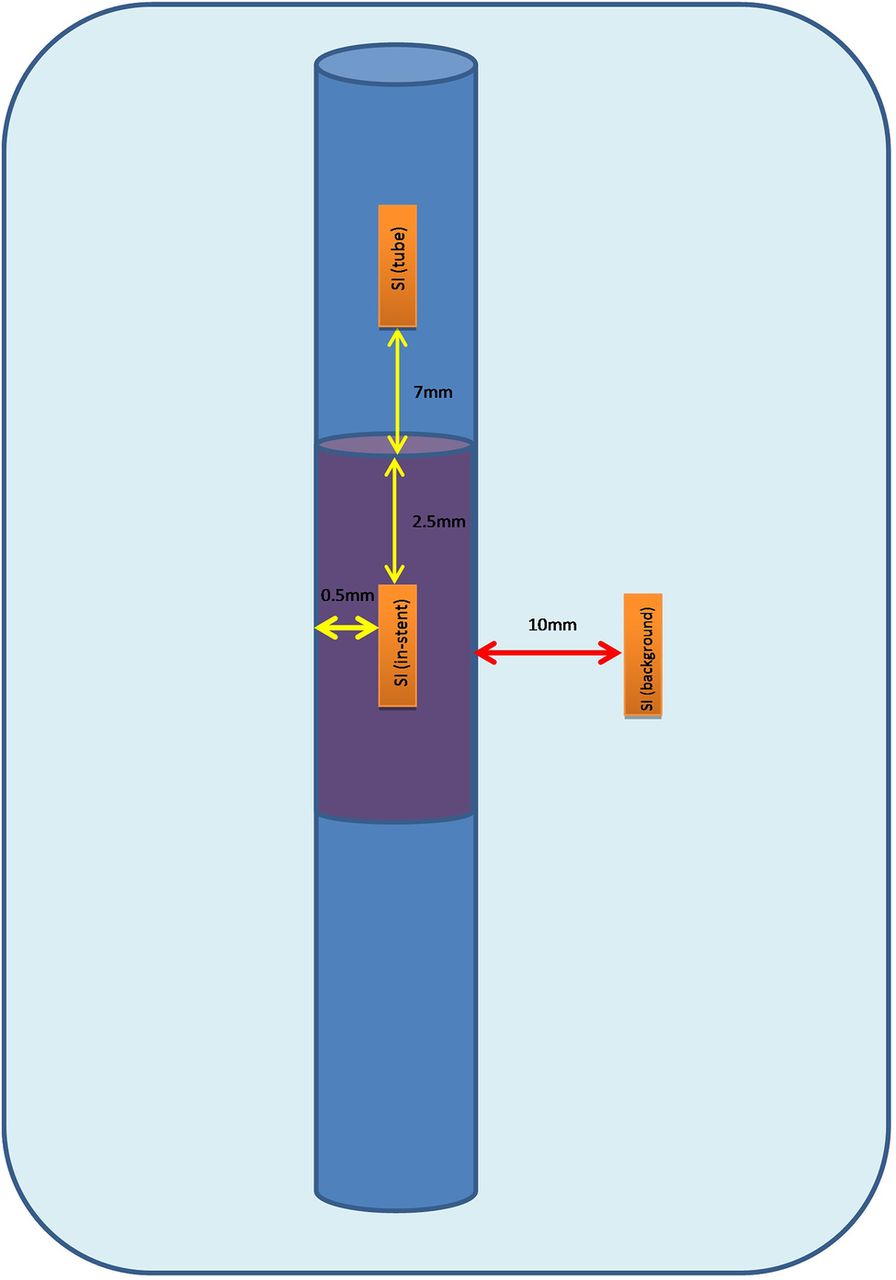
For the Enterprise stent, all measurements of signal intensities were obtained by measuring mean values for signal intensity (SI) from a constant 9 mm2 rectangular region of interest (ROI). They were placed manually and centered on the stent axis with a constant 2.5 mm from the two ends of the visible Enterprise stent and 1.5 mm away from the stent wall (SI in-stent). For the SI in the background (SI background), they were measured outside of the stent with ROIs placed parallel to the stent position with a distance of at least 10 mm between the tube and the ROI. For the SI within the tube (SI tube), the ROIs were placed within the tube but outside of the stent with at least 7 mm away from the stent to avoid the artifactual effects (figure 1).

Measurement of relative in-stent signal in the Enterprise stent. Every region of interest measurement is kept as a constant 9 mm2 rectangular box. SI, signal intensity.
For the Helistent, all measurements of SIs were made with a constant 3 mm2 of rectangular ROI. With the SI in-stent, the ROIs were placed within the stent and were kept with a distance of 2.5 mm from the two ends of the stent and 0.5 mm from the visible stent wall. For SI background, the ROIs were kept at a distance of at least 10 mm from the vascular phantom and for the SI tube, the ROIs were kept within the tube but at least 7 mm away from the stent (figure 2).

Measurement of relative in-stent signal in the Helistent. Every region of interest measurement is kept as a constant 3 mm2 rectangular box. SI, signal intensity.
Artificial luminal narrowing
Experience from previous trials allowed us to adopt to a more objective pixel by pixel analysis for evaluation of artificial luminal narrowing (ALN).4 ,13 ,14 The Dicom images obtained from MRI were transferred to a standard PC and analyzed with Freeware (Image J, National Institutes of Health). SI profiles were obtained continuously from both the inside the mid-segment of the stent and outside the stent across the rectangular plastic box with the direction perpendicular to the long axis of the stent (figure 3). To obtain the SI of the background saline (SI background), we discarded the SI from the first 10 pixels and the last 10 pixels from the SI plots outside the stent and then calculated the mean SI values from a total of 20 pixels—that is, 10 pixels to the right and left of the Enterprise vascular phantom, respectively, along these plots (outside the stent). For the vascular phantom containing the Helistent, the only difference was that we discarded the SI from the first five pixels and last five pixels from the SI plot. The tube lumen (D tube) was defined as all pixels with SI more than twice the SI background on the SI plot that was drawn outside of the stent. For the in-stent lumen diameter (D in-stent), we followed the same protocols by placing the SI plots across the midline and perpendicular to the stent and then obtained the left and right margin of the stent diameter by identifying the two points where SI exceeded twice the background SI. The apparent in-stent diameter was defined as the number of pixels between these two points (Din-stent). Artificial lumen narrowing was then expressed as:
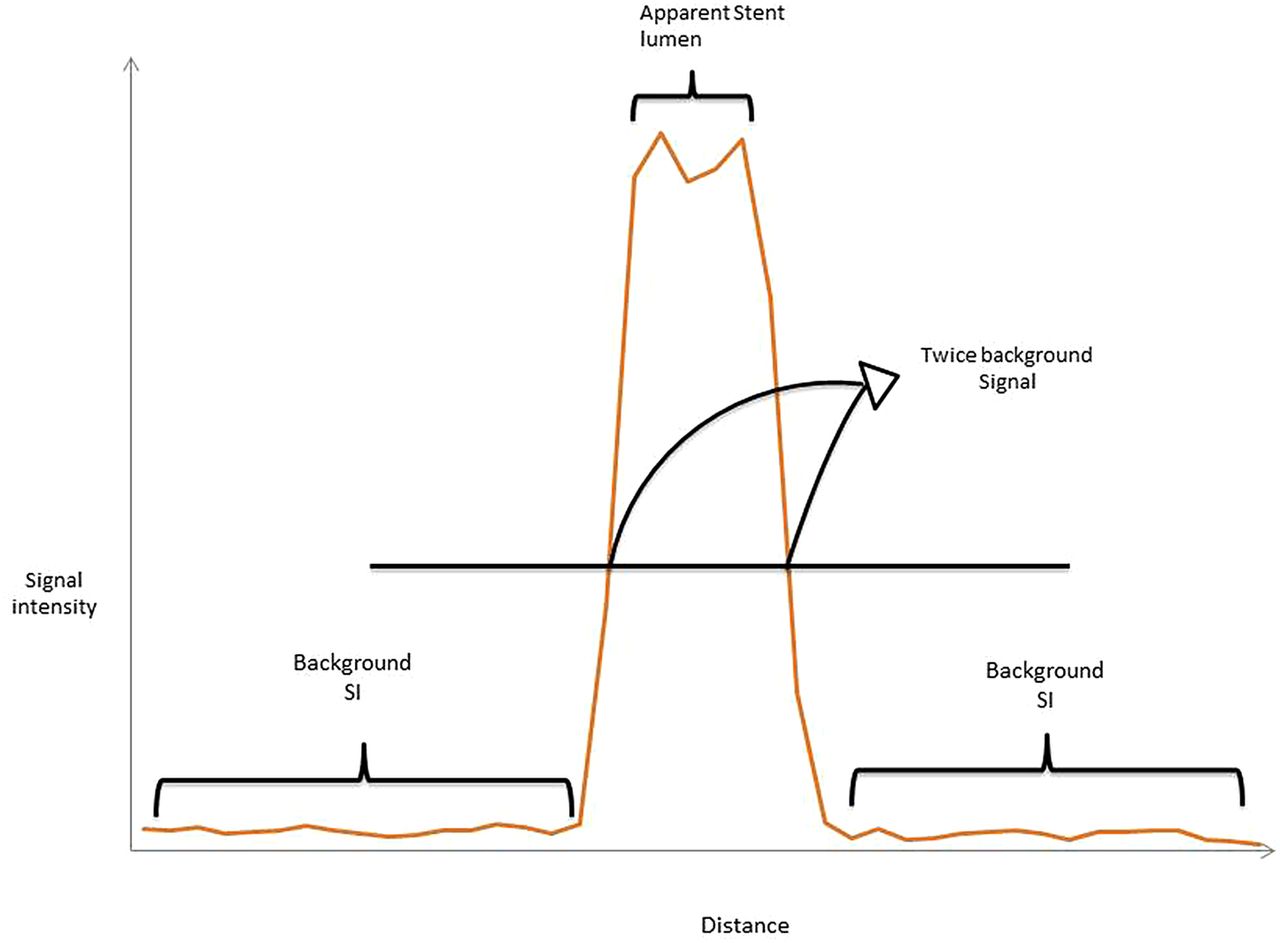
Schematic diagram of signal intensity plot perpendicular to the long axis of the stent. The apparent stent lumen is defined as the distance on the plot where the signal exceeded twice the background signal. SI, signal intensity.
In accordance with this formula, higher ALN values correlated with a smaller apparent lumen diameter on the images and therefore worse luminal visibility. The ALN calculation assumed that the stent strut thickness was negligible.
Statistical analysis
The independent sample t test was used to statistically evaluate the difference in relative in-stent signal (RIS) and ALN between different concentrations of the dimeglumine gadopentetate solution. A p value of <0.05 was considered to indicate statistical significance.
Result
Relative in-stent signal
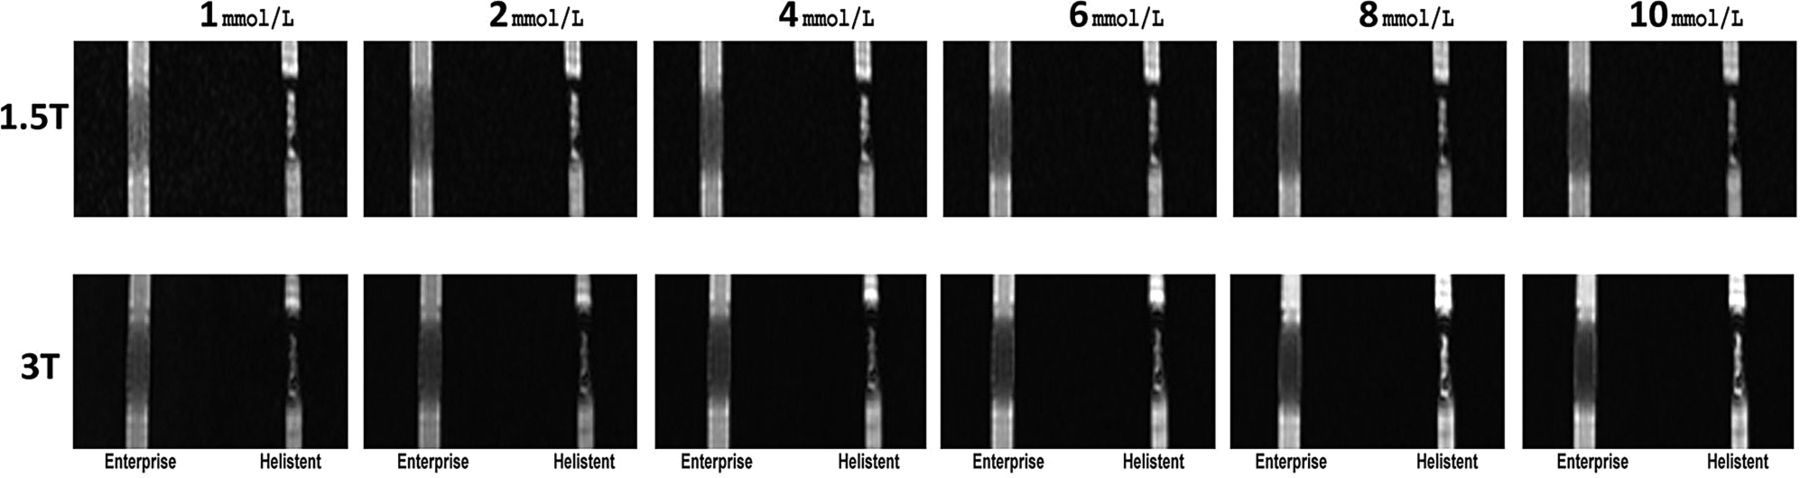
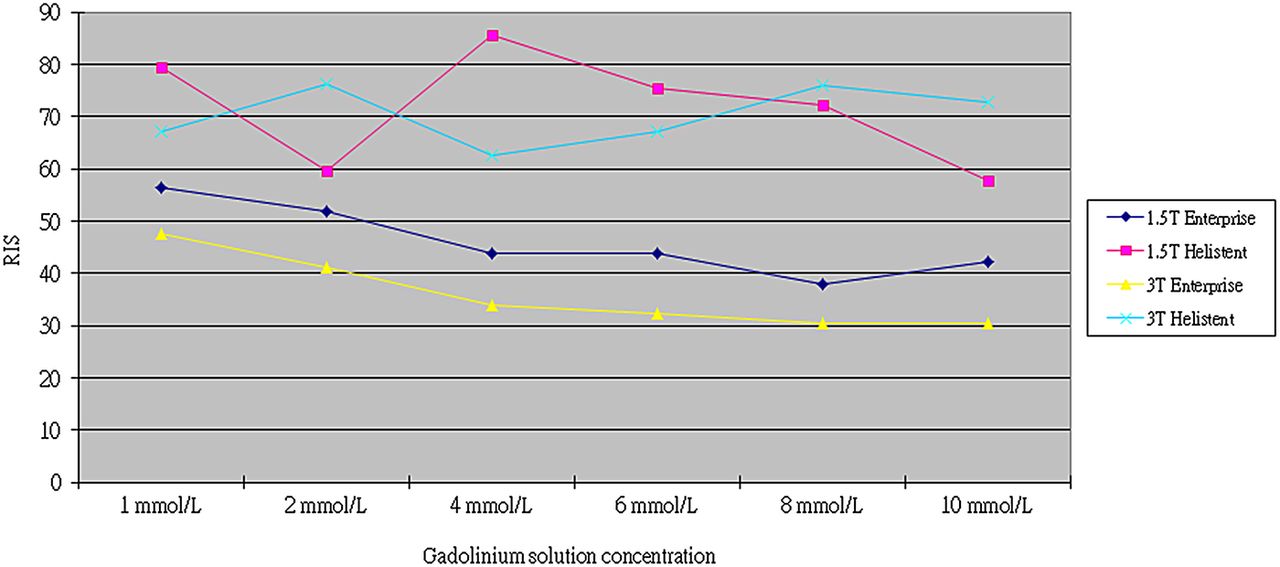
In-stent SI reduction occurred with all different concentrations of gadolinium solution for both stents, and was perceptible visually (table 2, figure 4). Across all different concentrations of the gadolinium solution, the Enterprise stent, whether performed in 1.5 T or 3 T MRI, showed mean RIS values much less than those for the Helistent, and the difference reached statistical significance (table 3). For the Enterprise group, RIS values gradually decreased as the concentration of the gadolinium solution increased in both the 1.5 T and 3 T MRI systems except the one performed in 1.5 T MRI with the 10.0 mmol/L dimeglumine gadopentetate solution (figure 5). Similar trends were not observed in the Helistent group.
Calculated relative in-stent signal in four different groups of MR system/stent types with corresponding mean (SD) values
Relative in-stent signal of the Enterprise and Helistent using various concentrations of the gadolinium solution at 1.5 T and 3 T MRI

Coronal images of the Enterprise and Helistent using a maximum intensity projection technique.

Relative in-stent signal (RIS) of the Enterprise and Helistent with different doses of gadolinium solution in the 1.5 T and 3 T MR systems.
When comparing mean RIS for the Enterprise group between 1.5 T and 3 T MRI, the mean RIS in the 3 T MRI was lower than in the 1.5 T MRI and it reached statistical significance (p=0.0309). A similar trend was also observed in the Helistent group. However, it did not reach statistical significance (table 3). The Helistent group showed higher RIS compared with the Enterprise group, whether performed in 1.5 T or 3 T MRI, with these differences reaching statistical significance.
Artificial luminal narrowing
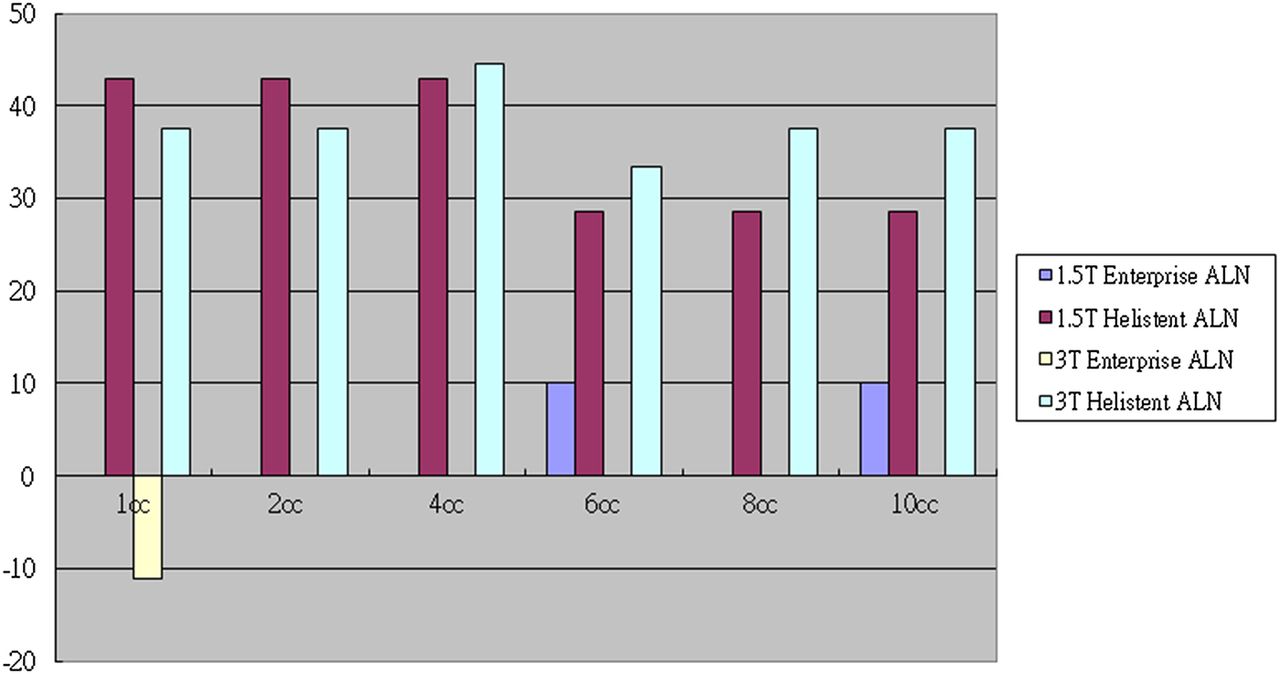
The majority of ALN values for the Enterprise group were zero for various doses of the gadolinium solution and in both MRI systems used, which suggested good overall luminal visibility. The Enterprise group generally showed much lower ALN values compared with the Helistent group and this suggested that the Enterprise stent had better luminal visibility compared with the Helistent (figure 6). For the Helistent group performed in 1.5 T MRI, increasing dose of gadolinium (6–10 mmol/L) improved luminal visualization, which corresponded to a reduction in ALN values (table 4). However, for the Helistent performed in 3 T MRI, no such trend was observed for ALN values.
Artificial luminal narrowing values obtained using pixel by pixel analysis
Artificial luminal narrowing (ALN) of the Enterprise and Helistent using various concentrations of gadolinium solution at 1.5 T and 3 T MRI.
The difference in mean ALN values reached statistical significance between the Enterprise and Helistent groups performed in the 1.5 T MRI system (p<0.0001) and the 3 T MRI system (p<0.0001) (table 5). However, no statistical significance was shown when comparing the mean ALN values of the Enterprise group between the 1.5 T and 3 T MRI systems (p=0.0944) and the Helistent group (p=0.5383).
Artificial luminal narrowing of the Enterprise and Helistent using various concentrations of gadolinium solution at 1.5 T and 3 T MRI
According to our study, there was no correlation between SI within the stent and apparent narrowing of the lumen.
Discussion
In our study, the RIS value generally decreased for the Enterprise group as the gadolinium dose increased. However, a similar trend was not observed in the Helistent group. This is probably due to the fact that the in-stent SIs stayed relative stationary compared with the SIs from within the tube in the Enterprise group whereas no such relationship existed in the Helistent group. This may suggest that the RIS value is difficult to predict if the stent is made of material other than nitinol.
No trends were established on how changing concentrations of the gadolinium solution affected the ALN values in both the Enterprise and Helistent groups, except in the Helistent group performed in 1.5 T MRI which showed ALN reduction as the concentration increased. However, the majority of ALN values for the Enterprise group were zero, despite various doses of the gadolinium solution and MRI machines used, which suggested good overall luminal visibility.
In our study, we assumed the gadolinium concentration of 2 mmol/L as the standard dose, as used by many previous studies.3–4 ,8 ,13 ,15–17 For the Enterprise group, the RIS values were highest at a concentration of 2 and 1 mmol/L of gadolinium solution and the ALN values remained mostly at zero under these concentrations. Therefore, based on our study, a standard dose or even a half dose may be recommended in daily practice for best visualization of the patency of the Enterprise. For the Helistent group, ALN values were highest from 1 to 4 mmol/L, which were half to twice the standard dose. However, the RIS values were inconsistent for such a conclusion to be drawn.
There are two main potential artifacts that may affect in-stent visibility. The first is a magnetic susceptibility artifact and the second is a radiofrequency (RF) artifact. The RF artifact results from the eddy currents induced inside the stent struts. These eddy currents produce an opposing RF field, shielding out the RF pulse and thus diminishing signal strength.14 ,18 A magnetic susceptibility artifact is caused by local inhomogeneities in the magnetic field when two tissues with different magnetic susceptibilities are juxtaposed.9 ,10 In this in vitro study, the stent struts, gadolinium contrast medium within the stent, the polyvinyl chloride tube, and the normal saline solution all combined together to cause this artifact. The degree of image degradation by these two artifacts from the stents is highly variable depending on the type of stent.
Unlike the stainless steel or cobalt alloy stents, nitinol stents are relatively more sensitive to RF artifacts than to susceptibility artifacts.9 ,18 Wang et al19 demonstrated that the signal loss due to RF artifacts was 31–62% for nitinol stents and the susceptibility induced signal loss was negligible (<1%) for non-stainless steel (nitinol, platinum, cobalt alloy) stents and totally destructive (100%) for stainless steel stents. A well known theory is that the use of a small voxel, short TE, short TR, wide sampling bandwidth, and parallel imaging would help reduce the magnetic susceptibility artifact.9–12 Our CEMRA protocol of using the shortest TR and TE with a wide bandwidth is likely to reduce the magnetic susceptibility artifact caused by the Helistent.
A previous study done by Seok et al9 comparing two intracranial nitinol stents showed that the ALN at 1.5 T was significantly lower than the ALN at 3 T. However, Hahnel and Lettau et al3 showed the opposite result, with less ALN in the 3 T compared with the 1.5 T system for nitinol carotid stents. 15 Lettau et al used various sizes of carotid stents with diameters ranging between 5 and 10 mm and with different materials, whereas Seok et al used only two intracranial nitinol stents and with diameters of 4.5 and 4 mm. Whether the differences in material and size of stents led to the differences in results is uncertain. In our study, the mean value of ALN for the Enterprise group performed in 3 T MRI was −1.85 and was lower compared with 1.5 T MRI, which suggested better luminal visibility and were consistent with the findings by Hahnel and Lettau et al. However, this result did not achieve statistical significance.
In our study, the nitinol based Enterprise stent generally showed a poor mean RIS compared with the stainless based Helistent. This trend remained whether the images were acquired in 1.5 T or 3 T MRI or using different concentrations of dimeglumine gadopentetate. A previous study by Frölich et al14 showed that the RIS for CEMRA were perhaps affected by several factors: stent diameter, and geometry and material of the stent. In their study, the RIS was generally higher for stents with larger diameters. Also, with the same nitinol based stents, those with open cell geometry showed better RIS. However, as the aim of their study was to evaluate the visualization of the in-stent lumen between CEMRA and three-dimensional time of flight MRA, these findings were not validated using statistical analysis. Despite this, these observations could still partly explain why the nitinol based Enterprise stent had a lower RIS in our study despite its larger diameter, as it has a close cell design.
The other study performed by Choi et al18 may also explain why the nitinol based Enterprise stent showed lower a RIS compared with the Helistent. They demonstrated that the thickness of the strut and cell design in intracranial stents appear to have an impact on the degree of RF artifact as they tried to optimize the MR parameters for time of flight MRA on 3 T MRI. They compared four different nitinol stents with different cell designs and strut thicknesses and under various MR parameters. Among them, the Enterprise stent had the worst RIS and they assumed this to be due to the fact that the Enterprise stent had the thickest strut size (0.08 mm) among the four stents and its close cell design, which caused more RF artifact.
Stent diameter also affects ALN. Hähnel et al15 found that a lower ALN on CEMRA at larger stent diameters in nitinol stents at 3 T and in stainless steel stents at 1.5 T and 3 T. Lettau et al4 found a similar trend between ALN and stent diameter—that is, ALN decreased with increasing stent diameter in all of the various stents that they used except one at 1.5 T and 3 T. Lettau postulated that the reason for this correlation was the proportionate nature of the ALN calculation. Therefore, as long as the absolute extent of artifacts remained the same for different stent diameters, the ALN will decrease with increasing stent size.4 In this study, the above trend applied as the smaller Helistent generally showed higher ALN compared with the Enterprise.
Our study had several limitations. First, our vascular phantom was made with polyvinyl chloride tube in a straight course. This is different from in vivo conditions where intracranial arteries are usually tortuous. Also, under in vivo conditions, the longitudinal axis of the stent in intracranial arteries would not always be parallel to the main magnetic field. Therefore, the RIS and ALN observed in a clinical scenario are likely to be different.
The strut thickness of the stents and the lumen size of the polyvinyl chloride tube were further limitations. These differences may result in different degrees of artifacts and may have affected our results.
The lack of flow and pulsatility in our phantom design may reduce comparability with an in vivo environment. However, CEMRA depends on the T1 shortening effects of gadolinium contrast agent and is less affected by flow and motion, compared with time of flight MRA.3 ,20 Therefore, our design may have created adequate simulation of an in vivo environment in this regard. Also, in our study design, the background was normal saline whereas under in vivo conditions, the background is usually brain parenchyma and/or CSF. Therefore, the homogenous liquid surrounding our phantom is not comparable with the in vivo scenario.
The investigated concentration of dimeglumine gadopentetate may not simulate the concentration of gadolinium contrast agent found in intracranial arteries. However, the gadolinium contrast agent concentration of 2 mmol/L was used in multiple previous studies3–4 ,8 ,13 ,15–17 and we included this concentration in our study and multiplied it by factors from 0.5 to 5 as our best attempt to simulate the possible concentration found in intracranial arteries.
Conclusion
In this study, we investigated the influence of gadolinium contrast dose on SI characteristics (RIS) and luminal visualization (ALN) for two stents that can be used intracranially under in vitro conditions. Our results showed that the Enterprise stent demonstrated overall good luminal visualization in terms of ALN, regardless of gadolinium dose and the MRI machine used. RIS were more predictable in the Enterprise stent with various doses of gadolinium. Therefore, the Enterprise stent was shown to provide better in-stent visibility compared with the Helistent using various gadolinium doses.
Acknowledgments
We thank Yu-Chia Chien and Hung-Yi Chien for their technical support on this study.
References
Footnotes
Contributors Study concept and design: C-HC, Y-CT, A-CC, and H-LH. Literature research: Y-LH and DY-TC. Data acquisition: C-HC, Y-CT, A-CC, and DY-TC. Data and statistical analysis: Y-LH, DY-TC, A-CC, and Y-KL. Manuscript preparation: C-HC, A-CC, C-JC, and H-LH. Manuscript editing: C-HC, Y-LH, C-JC, and H-LH. Manuscript review: C-HC, Y-CT, Y-LH, C-JC, and H-LH.
Competing interests None declared.
Provenance and peer review Not commissioned; externally peer reviewed.
Data sharing statement The authors agree to share any data on request.