Article Text

Abstract
Background Treatment of intracranial aneurysms with flow diverter stent (FDS) procedures can lead to caliber changes of jailed vessels. The reason some branches remain unchanged and others are affected by narrowing remains unknown.
Objective To investigate the influence of resistance to flow from distal vasculature on stent-induced hemodynamic modifications affecting bifurcating vessels.
Materials and methods Radiological images and demographic data were acquired for 142 aneurysms treated with a FDS. Vascular resistance was estimated from patient-specific anatomic data. Correlation analysis was used to identify correspondence between anatomic data and clinical outcome. Computational Fluid Dynamics was performed on a typical patient-specific model to evaluate the influence of FDS on flow. Relevant hemodynamic variables along the bifurcating vessels were quantitatively analyzed and validated with in vitro data obtained using power Doppler ultrasound.
Results Statistical analysis showed a correlation between clinical outcome and FDS resistance to flow considering overall jailed vessel vascular resistance (r=0.5, P<0.001). Computational predictions of blood flow showed that hemodynamics is minimally affected by FDS treatment in the ophthalmic artery.
Conclusions Jailed vessels are affected by narrowing when resistance to flow from the FDS constitutes a larger proportion of the overall vessel resistance to flow. This knowledge may contribute to better understanding of intracranial hemodynamics after a FDS procedure and reinforce indications for flow diversion in the treatment of intracranial aneurysms.
- aneurysm
- blood flow
- flow diverter
- ultrasound
Statistics from Altmetric.com
Introduction
Flow diverter stent (FDS) procedures for proximal internal carotid artery (ICA) aneurysms are a common treatment, with high aneurysm obliteration rates. Neurological impairment remains relatively low considering that FDS covers the aneurysm neck and also side wall arteries, such as the ophthalmic (OphthA) and anterior choroidal arteries,1–3 which seem to be less affected than bifurcating arteries when jailed by FDS.4–12 Narrowing and occlusion are a common event after a FDS procedure for middle cerebral artery (MCA) and some anterior cerebral artery (ACA) bifurcation aneurysms (MCA and ACA bifurcations without opposite A1), and anatomic parameters could be involved in hemodynamic changes that affect the vessel wall. Asymmetry of branches, hemodynamic alterations, and clinical outcome after treatment with FDS for bifurcation aneurysms have been correlated in a study that identified an anatomic threshold of the daughter vessel diameter ratio (0.7) below which FDS-induced alterations of volumetric flow rates and significant changes in wall shear stress (WSS) correlate with poor clinical outcome.13 It is difficult to apply this theory to proximal ICA aneurysms because the ratio of OphthA to ICA is lower than 0.7, and a jailed OphthA remains mostly patent. Iosif and colleagues evaluated the presence of collaterals converging to the same territory of the jailed artery to explain the narrowing process. However, this hypothesis does not explain OphthA permeability after FDS procedures as collaterals are often present in this territory too.14
In an attempt to explain this phenomenon, Cebral et al 15 proposed high peripheral vascular resistance (RPER) as the most significant factor affecting hemodynamics and possibly vessel caliber changes after FDS treatment. Their study showed that computational estimations of blood flow patterns in the jailed arteries are only minimally affected by the small perturbation imposed by the FDS and mainly influenced by the much larger resistance to flow imposed by the peripheral bed distal to these small arteries. Blood flow distribution throughout the cardiovascular system is highly influenced by RPER, which can be considered a viscous impediment to blood flow in a vessel, as described by the Hagen-Poiseuille relationship that links pressure to flow.16 This relationship shows that resistance, or impediment to flow, increases with higher values of blood viscosity (hematocrit), vessel length, and smaller vessel radii.
This study aimed to perform a quantitative estimation of the factors affecting hemodynamics of FDS-jailed arteries, with a focus on the quantification of the impediment to flow from the FDS (RFDS) in relation to the overall artery resistance (RTOT) to flow, and for a larger cohort of datasets. The study also includes an experimental validation of our theoretical and numerical observations using power Doppler-ultrasound (PD-US).
Materials and methods
The hypothesis of this study is that clinical outcome and FDS-induced hemodynamic alterations depend on the relative significance of RFDS to flow with respect to overall artery resistance (RTOT= RFDS+RJV +RPER) in the jailed artery (where RJV = local jailed artery resistance). The methodology of this study was developed to test this hypothesis and organized within three different phases: phase I=analysis of clinical data (radiological and demographic) for estimation of vascular resistances and possible associations with clinical outcomes; phase II=patient-specific computational fluid dynamics (CFD) analysis of flow through a typical OphthA aneurysm to analyze and illustrate the effect of RFDS on flow at a location normally less affected by vessel narrowing; phase III=validation of numerical predictions through experimental analysis.
Phase I
Clinical data from 142 patients were retrospectively collected at the University Hospital of Tours, Toulouse and Poitiers, France, and Alfried Krupp Krakenhaus, Germany. Appropriate ethical approval and patient consent were obtained. Bifurcation aneurysms from the MCA, basilar artery with hypoplasia of the posterior communicating artery, and anterior communicating artery aneurysms with agenesis of the contralateral anterior cerebral artery, treated with FDS between December 2010 and December 2015, were included (25 aneurysms from 25 patients). Data on OphthA aneurysms were collected between December 2014 and December 2017 (117 aneurysms from 117 patients). All patients included had 3D angiography before FDS positioning and at 3–6 months' follow-up. Images were acquired using a biplane X-ray system (General Electric Healthcare Innova IGS 650, Marlborough, Massachusetts, USA) during a 240 degrees rotation for a duration of 5 s and for a total of 244 projections. This resulted in a 3D volume dataset of 512×512×512 voxels covering a field of view of 116 mm.
Table 1 illustrates the demographic constitution of the data together with jailed vessel outcomes, anatomic information (lumen diameter), and estimations of local resistance to flow. Resistances were calculated from jailed vessel patient-specific diameter values using Hagen-Poiseuille’s theory R=8 µ L/(πrˆ4), where µ=0.0035 Pa.s is whole blood viscosity, L is vessel length, and r is lumen radius. Typical values of vessel length for jailed arteries and RPER values were taken from Reymond et al.17 Three vessel diameter values were taken from radiological images by two fully trained neuroradiologists along the vessels of each bifurcating branch (figure 1), reporting only their arithmetic average value and their SD to quantify interobserver variability. OsiriX was used to measure vessel diameters from 2D acquisitions by digital subtraction angiography and 3D-angiography images. Two-way, mixed intraclass correlation coefficients with 95% confidence intervals were used to assess the reliability of measurements. Two-tailed Pearson correlation analysis was performed to identify associations between clinical outcome, anatomic data, and estimation of vascular and relative RFDS to flow. Although normally a probability value of P<0.05 is sufficient to test correlation significance, for our relatively small cohort, we used a more stringent significant condition and set a P value of <0.01 as the probability value threshold.
Demographic constitution and anatomic data of the patient population.

Measurement protocol followed to extract bifurcation-vessel diameter values. Red arrows indicate approximate locations of measurements, black arrows indicate approximate distances (d=parent vessel lumen diameter at the aneurysm location) among consecutive measurements locations. A similar measurement protocol was followed for aneurysms at other locations.
Phase II
For patient-specific CFD analysis, an aneurysm located at the OphthA segment was selected. Medical image segmentation and surface reconstruction were performed using the @neurIST computational tool chain.18 Blender® was used for removal of artifacts and further surface mesh refinements. FDS was deployed virtually, in accordance with clinical procedures, and using the process described by Larrabide et al.19 The FDS model represents a typical Surpass FDS (Stryker, Kalamazoo, Michigan, USA) of 4 mm diameter with 72 wires. For the same patient-specific geometry we run several analyses, with and without a stent, and under different flow conditions.
The equations governing the physics of steady laminar flow were solved using ANSYS CFX (ANSYS, Canonsburg, Pennsylvania, USA). Blood was assumed incompressible (density ρ=1050 kg/m3) and Newtonian (viscosity μ=0.0035 Pa.s). Appropriateness of modeling approaches and accuracy of the numerical solutions were ensured by adopting methodologies that we have previously reported.13 18 20 21 The mesh used for the unstented model comprised approximately 0.8 million nodes (4 million nodes for the stented model) and 2.7 million elements (19 million elements for the stented model), resulting in a mesh volumetric density of 2.7 thousand elements per mm3 (19 thousand elements per mm3 for the stented model). Typical volumetric flow rates, time-averaged along the cardiac cycle, were imposed at the inlet in the form of a fully developed parabolic velocity profile to mimic peak systolic (Qin=4 mL/s) and end diastolic (Qin=7.5 mL/s) conditions. Outlet boundary conditions were imposed by mimicking typical resistance to flow imposed by the peripheral networks distal to the ICA and OphthA.17 RPER at the distal ICA outlet boundary was set to RICA=25 mm Hg.s/mL, whereas resistances at the OphthA outlet were set to ROphthA=470 mm Hg.s/ mL. CFD analysis and results were also used to obtain values of resistance to flow caused by the FDS by extracting values of pressure drops and flow across the wires and calculating resistance as R=ΔP/Q, where ΔP is the pressure drop measured across the stent wires, and Q the flow rate across the same location.
Phase III
CFD data were validated through PD-US measurements from life-size silicone replicas purposely produced for the study. Two silicone replicas of the geometry used in the CFD analysis were produced. The difference between the surfaces of the produced replicas and their target stereolithography (STL) surfaces was evaluated quantitatively using a position error index method.22 This resulted in a median value for the distribution of position errors across the surface mesh below 70 µm. One of the replicas received an FDS Surpass (Stryker, Kalamazoo, Michigan, USA), 4 mm diameter by 20 mm length with 72 wires, deployed by a senior intervention neuroradiologist (APN), who carefully placed the stent to match the CFD model. Both replicas were connected to a closed-loop circuit filled with ultrasound compatible blood-mimicking fluid and connected to a programmable pump (CompuFlow 1000, Shelley Medical Imaging Technologies, Toronto, Canada).
An Ultrasound System (Aixplorer Multiwave Supersonic Imagine, S.A.; Aix-en-Provence, France) equipped with a 256-element (SL15–4), 7.5-MHz linear-array transducer was used to take PD-US measurements of velocity magnitude along the OphthA from both replicas. Velocity profiles were extracted from PD-US along the OphthA and compared with identified FDS-induced changes and validation of CFD data (figure 2).
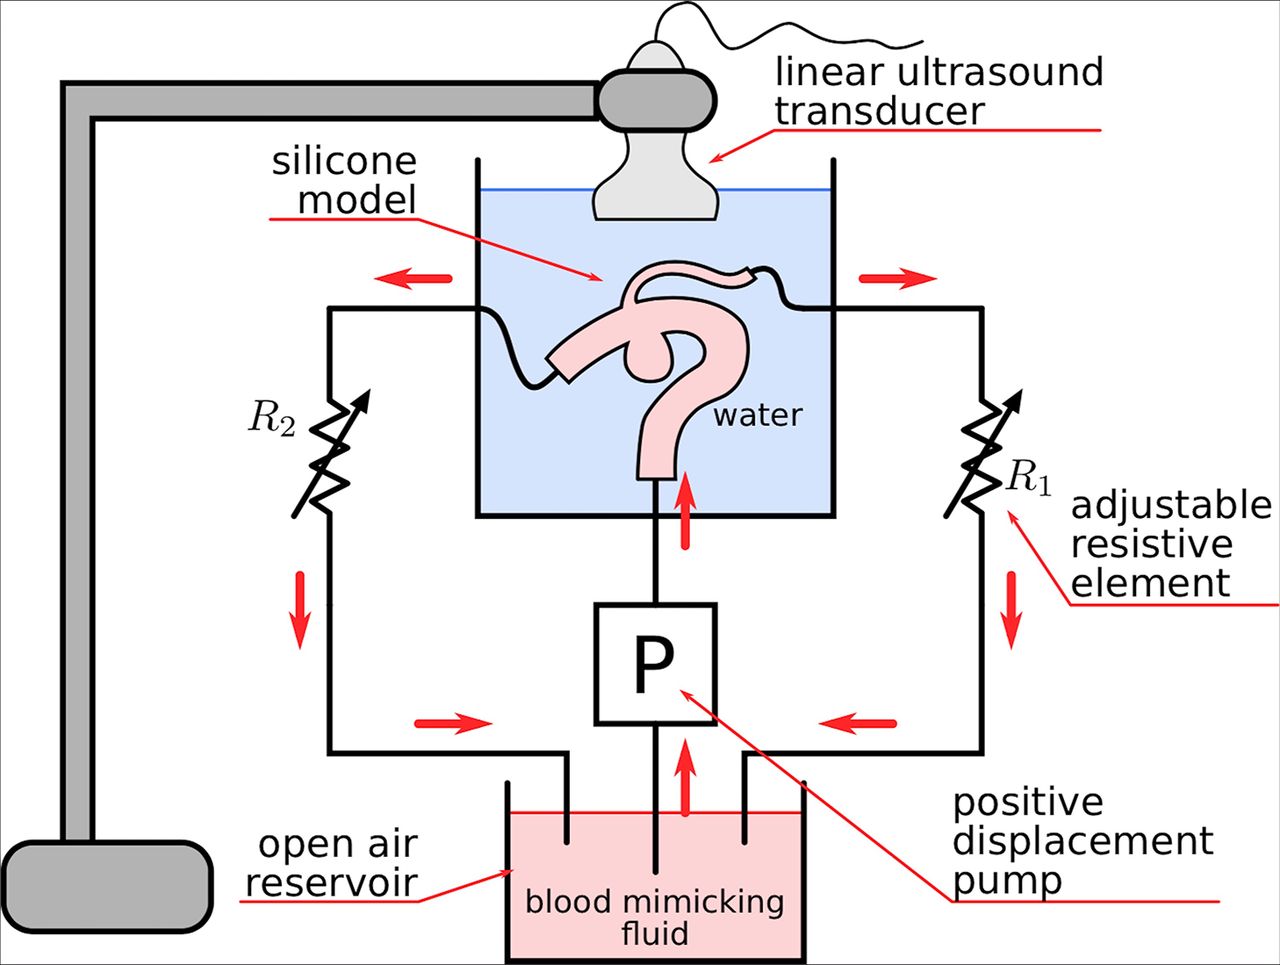
Closed loop circuit filled with ultrasound compatible blood-mimicking fluid and connected to a programmable pump. Silicone models were produced based on patient-specific geometry.
Results
Phase I: clinical data analysis results
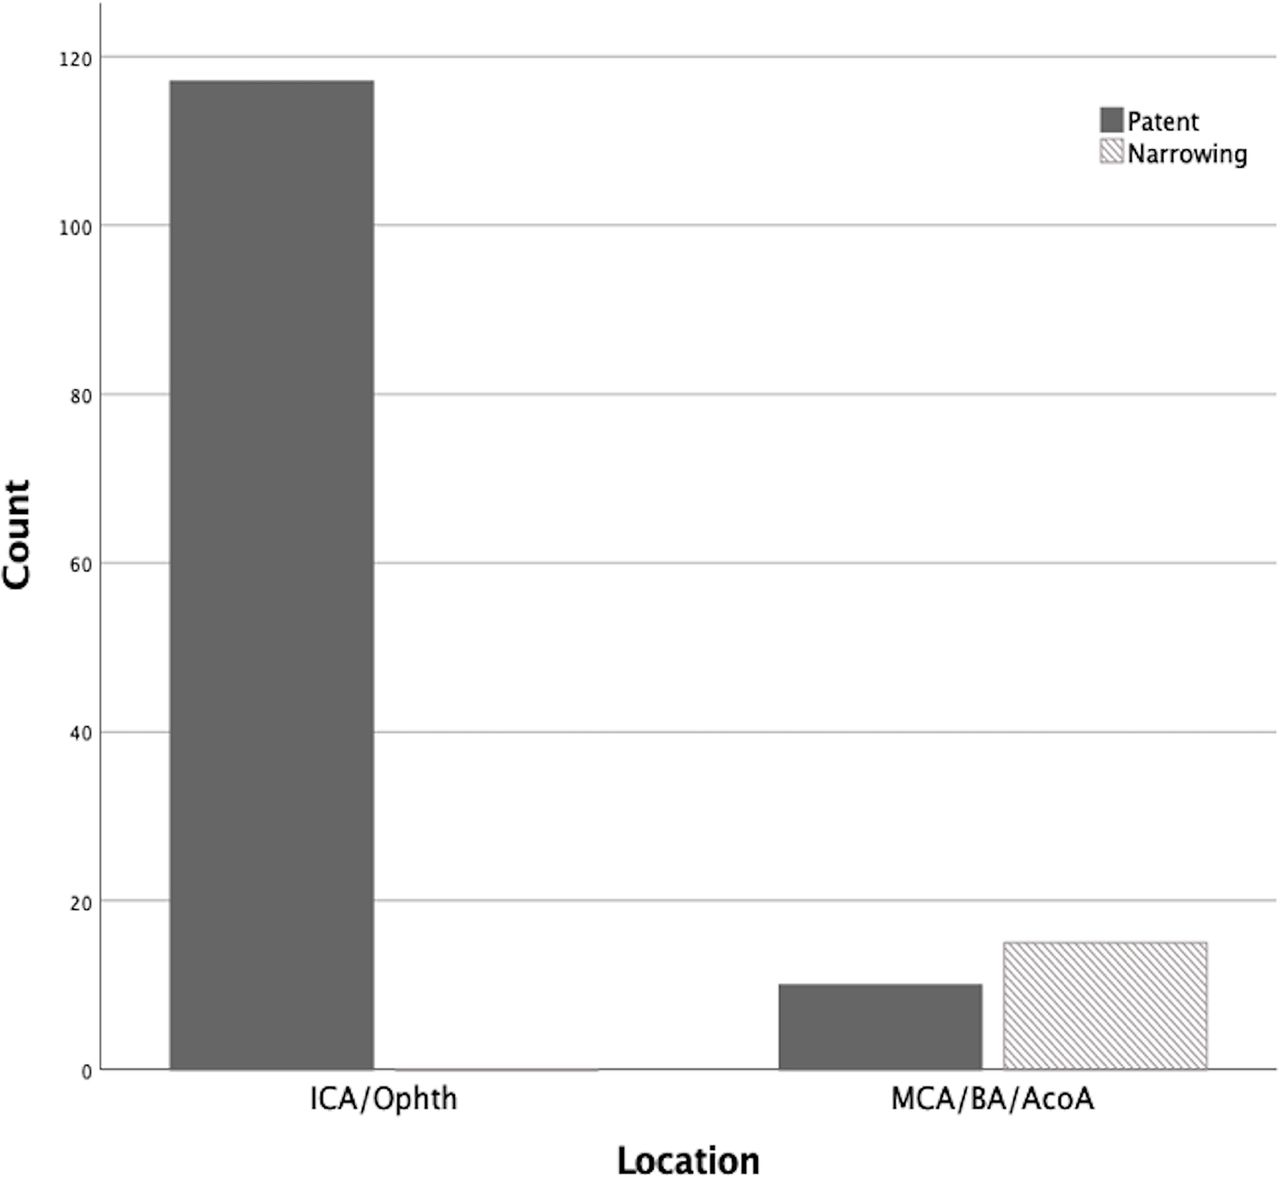
Reports of the incidence of vessel narrowing at each location, showing a higher incidence of clinical complications for vessels jailed by the FDS in bifurcating aneurysms and no complications for FDS treatment of aneurysms at OphthA location at 3 months' follow-up, are shown in figure 3. The intraclass correlation and Pearson correlation performed to assess the reliability of the anatomic measurements showed high interclass correlation coefficient (ICC=0.97, 95% CI, lower bound=0.95, upper bound=0.998, P<0.0001 and Pearson correlation coefficient r=0.743, P<0.0001). Mortality was not considered as only patients with control at 3 months follow-up were included.

Distribution of vessel narrowing (shadowed grey) and patent (dark grey) jailed vessels subgroup by location of aneurysm in internal carotid artery (ICA)/ophthalmic artery (OphthA) (left) and in middle cerebral artery (MCA)/basilar artery (BA)/anterior communicating artery (AcomA) bifurcations (right).
Box plots in figure 4 show the relation of RFDS with flow and with RTOT (RFDS +RJV+ RPER) for cases showing patency (no narrowing) and narrowing of the jailed vessel. The figure clearly indicates that cases where median RFDS to flow is low compared with RTOT are also the cases presenting no complications (figure 4, patent group, mean=1.05). On the contrary, cases with relatively higher RFDS to flow are also the cases presenting vessel narrowing (figure 4, narrowing group, mean=3.7). This correlation is statistically significant as shown by the correlation analysis reporting a Pearson correlation coefficient of r=0.5 (P<0.0001).

Whisker plots showing distribution of flow diverter stent (FDS) resistance to flow as a percentage of overall jailed vessel vascular resistance (RFDS%) for datasets showing jailed vessel patency (left, mean=1.048, lower bound=1.046, upper bound=1.05) and narrowing (right, mean=3.7, lower bound=3.33, upper bound=4.5). Solid lines within the boxes indicate median values. Each box plot describes the first quartile values (bottom black line), median values (middle black line), and third quartile values (top black line). Error bars (whiskers) show minimum (bottom black bar) and maximum (top black bar) values. Asterisks denote outliers identified using the maximum normed residual test.
Phase II: CFD analysis
The CFD results obtained for the patient-specific analysis of flow through an OphthA showed that FDS-induced changes mostly affect values within the aneurysm sac and parent vessel, and do not visibly affect values in the jailed OphthA (table 2 and figure 5). Table 2 reports FDS-induced changes on flow redistributions (ICA and OphthA outflow) at peak systole and end diastole, showing values below 0.5%. FDS-induced changes on WSS space averaged across the OphthA show reduction in values below 5%. In accordance with the quantitative values reported in table 2, figure 5 shows the spatial distribution of WSS magnitude across the patient-specific model, indicating that FDS-induced changes mostly affect values within the aneurysm sac and parent vessel, and do not visibly affect values in the jailed OphthA, both at peak systole and end diastole.

Wall shear stress (WSS) contours at peak systole (Qin=7.5 mL/s) for the unstented (top left) and stented (top right) models. WSS contours at end diastole (Qin=4 mL/s) for the unstented (bottom left) and stented (bottom right) models.
Quantification of FDS-induced changes to hemodynamic variables extracted from OphthA bifurcation at peak systole and end diastole. Average wall shear stresses, extracted from the OphthA. ICA, and Ophth outflow, are the volumetric flow rates calculated at the outlet of the ICA and OphthA, respectively
Phase III: validation results
Velocity profiles from both replicas were obtained from PD-US measurements. Profiles at the same positions along the OphthA were extracted and the changes were quantified using a normalized discrepancy index  . Profiles at four different positions are presented in figure 6. The discrepancy index, D, was computed up to 0.4 mm deep into the vessel owing to limitations in accuracy in the PD-US approach. Figure 6 presents the histogram of the discrepancy D (n=75 samples). The median of the discrepancy was 3.6%, in agreement with CFD analysis. The measurements corroborate the hypothesis that FDS does not induce significant changes to the flow in the jailed OphthA.

(Top) velocity profile power Doppler-ultrasound (PD-US) measurements (for Qin=4 mL/s) for the unstented (dashed line) and stented (solid line) replicas. The in-box images show the PD-US images and the locations along the ophthalmic artery (OphthA) where the velocity measurements were extracted (flow in OphthA directed left-to-right in in-box images). (Bottom) normalized velocity discrepancy obtained from 75 measurements taken at different locations along the OphthA. The continuous line indicates the median value and the dashed lines represent quartiles Q1 and Q3.
Discussion
The aim of the study was to investigate, for a cohort of 142 aneurysm datasets, the role of resistance to flow in flow changes induced by FDS treatment that may relate to vessel narrowing/occlusion in a subacute phase. The effect of FDS on flow distribution at symmetric and asymmetric bifurcations has been studied previously, but this was compared with a small number of cases (25), which was not enough to explain the changes in vessel diameter.13
Statistical analysis of the results of this study showed significant correlations between flow resistance attributed to the presence of the FDS and vessel narrowing at follow-up. Analysis of RFDS was considered as values relative to the overall resistance to flow, RTOT, encountered by the viscous flow of blood through the jailed vessel and distal RPER. RFDS, estimated from CFD simulations in the OphthA, was almost negligible (1%) in comparison with RTOT, mostly due to a large RPER. This was further reinforced by the CFD analysis, which showed that WSS values and flow redistributions were only marginally affected by the presence of the stent (changes ranging from 0% to 5%). Experimental data obtained with PD-US on a silicon replica of a typical OphthA found similar alterations to flow (median value=3.6%). The importance of RPER in side-wall branches after stenting was also highlighted by Appanaboyina et al 23 in their analysis of blood flow in three patient-specific models.
The study presented here goes one step further by estimating RPER and also all resistances encountered by blood as it flows through the jailed vessels and how these relate to the additional resistance to flow imposed by the stent. For these calculations lumen caliber data were derived from imaging data of 142 datasets. It is well established that flow distribution and WSS are heavily controlled by vessel anatomy and the viscous nature of blood, because smaller vessels, such as the OphthA, will oppose higher resistance to flow than relatively large vessels like MCA branches. So the presence of a FDS will not affect resistance in the OphthA because it is already high.
The distribution of RFDS to flow as a percentage of RTOT between cases showing jailed vessel patency and narrowing/occlusion was much higher (two- to sixfold) in this latter group. In those cases without narrowing, a series of outliers, ranging from 4.5- to 6.5-fold the RFDS%, can be observed. These outliers occur because the data have been collected from follow-up images. The narrowing is a biological response to a change in flow, which is not instantaneous and might take different times depending on the physiological condition of the patient, or might not happen at all.
This study has some limitations that should be highlighted. Some of the data used to compute vascular resistance were typical values from the literature (ie, blood viscosity, vessel length). Vessel tortuosity and its effect on flow resistance was not considered. This might result in some discrepancies between our estimations and the real values. However, these discrepancies could be negligible as the most influential parameter to flow resistance (lumen radius) was patient-specific. CFD-simplifying assumptions included Newtonian, incompressible, and stationary fluid, which were adopted in accordance with previously reported results, where it was observed that CFD variables like velocity and WSS resulting from steady state simulations were equivalent to averaging the same variables over the cardiac cycle for a transient simulation.24 In our study we are assessing pressure drop, velocity, mass inflow, and WSS at specific locations for a period of time that is considerably longer than a single cardiac cycle. Therefore, the use of steady state instead of transient CFD simulations is safe, with the additional benefit of a considerable reduction in computational time. The non-Newtonian effect on the above-mentioned variables is observed for shear rates at a much lower regimen than considered in this study.25 Vascular remodeling is a complex biological process strongly related to fluid-wall mechanics and their interaction. The study of vascular wall remodeling and wall change over time has been modeled computationally in the past with promising results.26 Nevertheless, the complexity of determining personalized wall properties and associated mechanobiological parameters makes the use of such models non-practical in the cases studied, which is a limitation. The link of such models to local hemodynamic parameters (WSS) that might induce vascular changes and remodeling should be a subject of future studies, to increase understanding of the reasons for these changes at follow-up.
Conclusions
Observations of FDS procedures in some bifurcation aneurysms and side-wall arteries seem to have different arterial narrowing/occlusion rates of the jailed arteries by the stent. This study identified statistically significant correlations between flow resistance and vessel narrowing that could explain large patency rates in OphthA in a cohort of 142 aneurysms. This was further supported by a numerical and experimental analysis of blood flow through a typical OphthA, which was used to identify and illustrate the mechanisms explaining these correlations. A complete understanding of the phenomena occurring will be possible only when mechanobiological pathways linking hemodynamic alterations to endothelial cells and arterial wall response (vasoconstriction or remodeling) are also considered. A better understanding of intracranial hemodynamics after FDS procedures is needed to reinforce indications of flow diversion in the treatment of intracranial aneurysms.
References
Footnotes
Contributors Conception and design: all authors; acquisition of data: APN, FM, IL, RC; analysis and interpretation of data: all authors; drafting of the article—AM; critically revising the article: all authors; reviewing the final version of the manuscript and approving it for submission: all authors; study supervision: APN, AM.
Funding This work was partially supported by the Newton Fund of the Royal Academy of Engineering grant number NRCP1415/2/20.
Competing interests None declared.
Patient consent for publication Not required.
Provenance and peer review Not commissioned; externally peer reviewed.
Data availability statement Data are available in a public, open access repository. Data will be made available through FigShare ORDA from the University of Sheffield upon publication of the study.