Article Text

Abstract
Objective: To establish the validity of visual interpretation of immediately processed perfusion computed tomography (CT) maps in acute stroke for prediction of final infarction.
Methods: Perfusion CT studies acquired prospectively were reprocessed within six hours of stroke onset using standard CT console software. Four contiguous 5 mm thick images were obtained and maps of time to peak (TTP) and cerebral blood volume (CBV) generated. Volumes of lesions identified only by visual inspection were measured from manually drawn regions of interest. Volumes of tissue with prolonged TTP or reduced CBV were compared with independently calculated volume of infarction on non-contrast CT (NCCT) at 24–48 hours, and with clinical severity using the NIHSS score. Arterial patency at 24–48 h was included in analyses.
Results: Studies were analysed from 17 patients 150 minutes (median) after stroke onset. Volume of tissue with prolonged TTP correlated with initial NIHSS (r = 0.62, p = 0.009), and with NCCT final infarct volume when arterial occlusion persisted (r = 0.953, p = 0.012). Volume of tissue with reduced CBV correlated with final infarct volume if recanalisation occurred (r = 0.835, p = 0.001). Recanalisation was associated with lower 24 h NIHSS score (6 (IQR, 5 to 9.5) v 19 (18 to 26), p = 0.027), and in 10 patients given rtPA for MCA M1 occlusion, with lower infarct volume (73 v 431 ml, p = 0.002).
Conclusions: Visual evaluation of TTP and CBV maps generated by standard perfusion CT software correlated with 24–48 hour CT infarct volumes. Comparison of TTP and CBV maps yields information on tissue viability. Perfusion CT represents a practical technique to aid acute clinical decision making. Recanalisation was a crucial determinant of clinical and radiological outcome.
- CBF, cerebral blood flow
- CBV, cerebral blood volume
- CTA, computed tomographic angiography
- MCA, middle cerebral artery
- MTT, mean transit time
- NCCT, non-contrast computed tomography
- NIHSS, National Institutes of Health stroke scale
- pCT, perfusion computed tomography
- ROI, region of interest
- TTP, time to peak
- stroke
- perfusion
- perfusion imaging
- computed tomography
Statistics from Altmetric.com
- CBF, cerebral blood flow
- CBV, cerebral blood volume
- CTA, computed tomographic angiography
- MCA, middle cerebral artery
- MTT, mean transit time
- NCCT, non-contrast computed tomography
- NIHSS, National Institutes of Health stroke scale
- pCT, perfusion computed tomography
- ROI, region of interest
- TTP, time to peak
Treatment of acute stroke is based on the concept of salvaging the “ischaemic penumbra,” a region of metabolically compromised tissue in which hypoperfusion is not severe enough to cause immediate cellular necrosis, but sufficiently severe to prevent electrical function of neurones, and to set in train a web of neurochemical derangements that will lead over time to cell death unless reperfusion or neuroprotective treatments are begun.1
Knowledge of brain perfusion in acute stroke is central to defining whether an individual has a penumbra.2 If this could be defined in an individual, management could be targeted so as to avoid treating patients in whom reperfusion had occurred spontaneously, and also those patients in whom tissue is already irreversibly ischaemic, who will derive only possible harm but no benefit from treatment. Clinical observations support these concepts. The best definition of the ischaemic penumbra in human stroke derives from positron emission tomography (PET) studies of quantitative cerebral blood flow and metabolism,2 but PET is an impractical technique for routine clinical evaluation.
Perfusion computed tomography (pCT) is a functional imaging technique that derives brain perfusion parameters from repeated imaging during the passage of an intravenous bolus of iodinated contrast. The change in density of individual pixels over time is analysed to yield several perfusion parameters, including time to peak (TTP), mean transit time (MTT), cerebral blood flow (CBF), and cerebral blood volume (CBV). Various combinations of these parameters have been validated against other imaging modalities—including diffusion and perfusion magnetic resonance imaging (MRI), clinical deficits, and outcome—in acute stroke patients.3,4,5,6,7,8,9,10 However, most previous studies have required post-processing of pCT data. In order to be incorporated into clinical decisions, pCT images need to be immediately available, and interpretation of these images should reliably predict tissue fate. We sought to evaluate the potential of pCT for aiding acute stroke management decisions by comparing visual inspection of images produced by software on the CT workstation with infarcts on follow up CT in patients scanned within six hours of stroke onset.
METHODS
All scans were undertaken as part of a routine clinical imaging protocol. Data analysis for this study was approved by the hospital local research ethics committee. Data from a prospectively collected dataset were retrieved for reanalysis. Subjects were included if they had a final diagnosis of acute ischaemic stroke in middle cerebral artery (MCA) territory; if pCT was done less than six hours after stroke onset; and if a follow up CT was done 24–48 hours after onset. Additional data analysed included National Institutes of Health stroke scale (NIHSS) score at baseline and at 24–48 hours, and MCA patency at 24–48 hours defined by CT angiography (CTA), conventional angiography, or transcranial Doppler ultrasound.
Intravenous thrombolysis was given according to the European product licence at the discretion of the responsible clinician.
All scans were acquired on a Philips MX8000 multislice CT scanner. Four contiguous 5 mm slices were acquired, imaged at two second intervals for 43 seconds. In most instances, the lowest slice was at the level of the basal ganglia, but this was amended according to the clinical scenario by the examining clinicians. Intravenous contrast (50 ml) was delivered by power injector at 6 ml/s. Perfusion maps for TTP and CBV were generated using the manufacturer’s software, which derives maps by the maximum slope method11 after manual selection of an arterial input function (the contralateral anterior cerebral artery was used for all processing). When undertaken, CTA through the circle of Willis was done after the pCT. Non-contrast CT was repeated at 24–48 hours, with slices matching the initial scan as closely as possible.
A single observer produced perfusion maps blind to clinical information. For pCT analysis, window settings were adjusted by the observer to maximise visual contrast between normal tissue and perfusion abnormalities. No thresholds could be set using the software package. Regions of interest (ROIs) were drawn manually around the margins of regions with prolonged TTP and around regions with reduced CBV on initial pCT. ROIs were drawn around the final infarct on non-contrast computed tomography (NCCT) at 24–48 hours in order to derive final infarct volume. The sum of ROI areas was multiplied by slice thickness to derive lesion volumes. All scans were processed and then analysed twice by a single observer (HH), the second measurements being blind to the results of the first. A second, independent, observer (KM) also processed and analysed TTP maps. Intraobserver and (for TTP) interobserver coefficients of variation for lesion volumes were calculated.
Correlations between initial perfusion lesion volumes and final infarct volumes were sought by Pearson’s product moment correlation coefficient. NIHSS scores were compared by the Mann–Whitney U test. Lesion volumes were compared using unpaired t tests.
RESULTS
Thirty three subjects underwent pCT, of whom 17 fulfilled study criteria. Subjects were excluded because they had a final diagnosis other than acute ischaemic stroke (9), because movement artefact degraded pCT data (2), because of lack of follow up CT (3), or because of lost or corrupted data (2).
Lesion volume analyses were reproducible, with intraobserver coefficients of variation of 3.2% (TTP), 6.6% (CBV), and 6.1% (NCCT). Interobserver coefficient of variation for TTP was 8.6%. Interobserver variation was not assessed for CBV.
Thirteen subjects had proximal and four had distal MCA occlusions. Twelve of the seventeen received intravenous recombinant tissue plasminogen activator (rtPA). In three subjects, treatment was marginally delayed beyond three hours (189, 200, and 200 minutes). Recanalisation at 24–72 hours occurred in nine of 12 rtPA treated and three of five untreated cases (table 1). Median time from onset to pCT was 150 minutes (interquartile range (IQR) 115 to 200); 11 patients were imaged less than three hours after onset, and six were imaged three to six hours after onset. Median NIHSS score at baseline was 16 (IQR 11 to 21), and at 24 hours it was 6 (5 to 14). Median NIHSS score at 24 hours was significantly lower in patients with evidence of recanalisation at 24–48 hours than in those without (6 (5 to 9.5) v 19 (18 to 26), p = 0.027, Mann–Whitney U test).
Characteristics of patients according to the use of thrombolytic treatment
Baseline NIHSS score correlated with TTP lesion volume (r = 0.62, p = 0.009) but not CBV lesion volume (r = 0.32, p = 0.21). In those in whom recanalisation had not occurred at 24–48 h, final infarct volume correlated with initial TTP volume (r = 0.953, p = 0.012) but not significantly with CBV volume (r = 0.793, p = 0.110) (fig 1A). In those in whom recanalisation had occurred by 24–48 hours of follow up, final infarct volume correlated with initial CBV volume (r = 0.835, p = 0.001) but not with TTP volume (r = 0.357, p = 0.254) (fig 1B). Examples of the influence of recanalisation are shown in fig 2. The manual ROIs associated with calculations are superimposed (fig 3).

Relation between recanalisation, final infarct volume on computed tomography, and initial lesion volumes defined by prolonged time to peak (TTP) (panel A); and decreased cerebral blood volume (CBV) (panel B). Fitted linear correlation lines and Pearson’s moment correlation coefficient (r) are shown for each group.

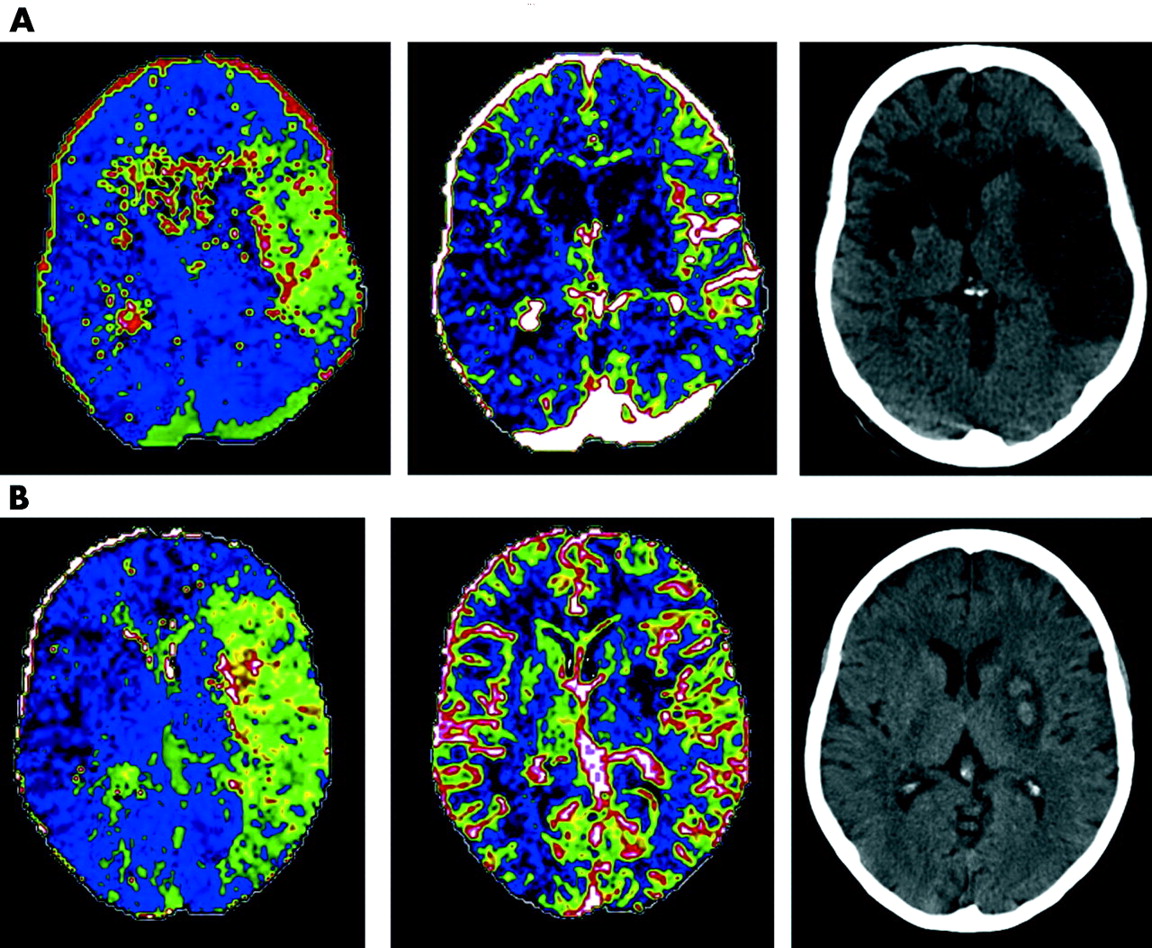
Examples of (A) no recanalisation (despite intravenous rtPA) and (B) recanalisation (with rtPA). Images shown represent (from left to right) initial time to peak (TTP), initial cerebral blood volume (CBV), and final computed tomography (CT). The subject shown in panel A had an old contralateral cerebral infarct, and the subject in panel B had haemorrhagic transformation associated with the infarct.
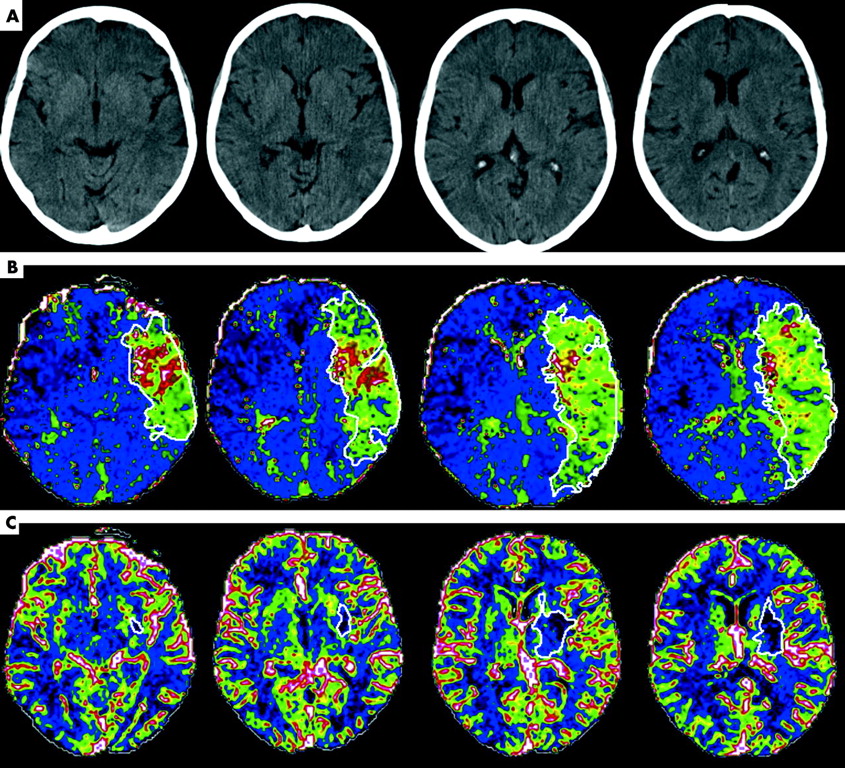
Example of manually drawn regions of interest (ROIs) (in the same subject as in fig 2B), showing (A) baseline non-contrast computed tomography; (B) time to peak (TTP) map with ROIs: total lesion volume over four slices 310 ml; and (C) cerebral blood volume (CBV) maps with ROIs: total lesion volume 18 ml.
Mean infarct volumes were greater in patients with persistent occlusion (301 v 55 ml, mean (SD) difference = 246 (101) ml, p = 0.068, unpaired t test (fig 4A). In 13 patients with MCA M1 segment occlusion, mean infarct volumes were also greater with persistent occlusion (301 v 70 ml, mean difference = 231 (102) ml, p = 0.08 (fig 4B)), despite almost identical baseline perfusion defects assessed by TTP lesion volume. In 10 patients given rtPA for M1 occlusion, this difference was significant (431 v 73 ml, mean difference = 357 (76) ml, p = 0.002).

Volume of initial perfusion lesion defined by prolonged time to peak (TTP) and 24–48 h infarct volume (each for four computed tomographic slices): (A) for all subjects (n = 17, p = 0.068 (unpaired t test) for final infarct volumes), and (B) for subjects with middle cerebral artery M1 occlusion only (n = 13, p = 0.08 for final infarct volumes). Expansion of infarct compared with initial perfusion defect is shown in persistent occlusion, and infarct volume less than initial perfusion defect with recanalisation. Error bars = SEM.
The change in NIHSS score from baseline to 24 hours was correlated with the difference in lesion volume between the 24–48 hour CT and the baseline TTP map (fig 5; Pearson correlation r = 0.69, p = 0.002; Spearman’s r = 0.70, p = 0.002). Failure to recanalise was associated either with no difference between clinical or radiological measures at 24–48 hours, or with some worsening, while recanalisation was associated with clinical improvement and final infarct volumes smaller than the initial TTP deficit.

Difference between initial time to peak (TTP) lesion volume and final infarct volume against change in National Institutes of Health stroke scale (NIHSS) scores between baseline and 24 hours by recanalisation status. Final computed tomographic lesion volume was generally smaller than initial TTP lesion volume and associated with reduced (improved) NIHSS score with recanalisation, and the reverse in persistent arterial occlusion. Overall correlation, r = 0.69, p = 0.002.
DISCUSSION
As tissue with delayed TTP but preserved CBV was potentially salvageable with recanalisation, this study supports the concept of a TTP–CBV mismatch on pCT as an index of the ischaemic penumbra.12 The predictive value of visual inspection of rapidly available images with only manual windowing, even by an inexperienced individual, confirms the potential of including pCT in therapeutic decisions, or as a selection tool for clinical trials.
Analysis of pCT has evolved with advances in computing speed and refinement of methodology. In early studies, data required to be transferred to workstations for post-processing.3,8,13 Many other pCT studies have not required immediate evaluation, and post-processing delays have not been specified.4–7,9,10,14,15 In other studies, immediately processed images were available, but were not used to determine tissue prognosis.16,17
Defining the ischaemic penumbra in an individual is key to targeting stroke therapy. Optimally, definition should be based on quantitative cerebral blood flow. However, while CBF estimates from pCT are close to those with xenon-CT or PET,18–20 the assumptions that underpin pCT analysis are probably invalidated by ischaemia,21,22 and alternative approaches may be required.
The first step is to define hypoperfused tissue at risk of infarction. We found that the TTP lesion correlated with the initial clinical deficit, and final infarct volumes in patients who did not recanalise approximated the initial TTP lesion volume very closely. The reproducibility of TTP volume measurements is consistent with previous studies indicating good contrast between normal and delayed TTP. Both perfusion MRI and previous pCT studies indicate that prolonged TTP or other indices of prolonged contrast transit such as MTT are sensitive indices of hypoperfusion.3,9 Prolonged TTP has generally tended to overestimate the final infarct volume by including tissue with “benign oligaemia,” unless more restrictive thresholds of delay in TTP are applied.23 In contrast, we found TTP volumes to be slightly smaller than final infarct volumes. This may be explained in several ways. First, the contrast colour scale may have led to conservative definitions of lesion margins with manual windowing. Second, the prevalence of extracranial occlusive disease in our population may have been lower by chance than in other studies: occlusive carotid disease may delay contrast bolus arrival and lead to overestimation of tissue at risk. Third, follow up CT at 24 to 48 hours was earlier than in many previous studies, and tissue swelling may therefore have contributed more to infarct volume. Finally, the selection of arterial input function may influence the TTP map.24 We found TTP lesion volume to be a reproducible and accurate estimate of tissue at risk.
The second tissue compartment necessary in defining the penumbra is the infarct core: various indices are thought to do this, including the lesion on diffusion weighted MRI, tissue with diminished CBV,4 visible hypodensity on NCCT, or tissue with hypodensity on a CTA source image (essentially an index of diminished perfused blood volume).9,25 Diminished CBV indicates failure of vascular reactivity, a pathophysiological hallmark of irreversible ischaemia, and is a logical parameter to indicate infarct core. At issue is how well a given technique can measure CBV. Our findings that the volume of tissue with reduced CBV correlated with final infarct volume when recanalisation occurred, and that the initial CBV lesion was always smaller than the final infarct, are consistent with reduced CBV signifying the infarct core. To what extent CBV lesions might underestimate the infarct core is unclear—CBV lesions were less than 10% of the total hypoperfused volume, and final infarct volumes were several times larger than the initial CBV lesions, but growth of lesions is inevitable owing to delayed reperfusion, even with recanalisation. Measurement of CBV lesion volume was prone to larger intraobserver variability which may simply reflect the inevitably greater error with smaller lesions, or alternatively suboptimal visual contrast between reduced and normal CBV. Other groups have found CBV to be more specific but less sensitive for the diagnosis of stroke in comparison with non-contrast CT.16,26 Others have reported CBV lesions to correlate with diffusion weighted imaging lesion volumes,9 a widely accepted approximation of the infarct core.
The study confirms that neurological recovery in the early stages of acute stroke is predominantly driven by salvage of the ischaemic penumbra, a concept first demonstrated for PET defined penumbra (using an increased oxygen extraction fraction as the definition)27 and more recently for pCT,5 with significant correlation of tissue volume salvaged with change in neurological severity.
The impact of recanalisation on penumbral salvage and clinical outcomes was confirmed by a significantly smaller neurological deficit at 24 hours, and lower final infarct volumes. The high rate of recanalisation (70%) reflects the inclusion in the study dataset of several patients with rapidly improving clinical syndromes accompanied by distal MCA occlusion, suggestive of spontaneous clot lysis. These patients were not treated with rtPA and had smaller baseline perfusion lesions. Their inclusion superficially distorts the ability to demonstrate a treatment effect of thrombolytic therapy in this inhomogeneous group. Nevertheless, statistical analysis of a more homogeneous subset—patients with M1 occlusions treated with rtPA—was able to show significantly lower infarct volumes with recanalisation, even in this very small sample.
There are various limitations to our study. First, findings were derived exclusively from patients with acute MCA stroke syndromes. Reduced sensitivity is reported to posterior circulation, small cortical branch, or lacunar strokes.28 Second, pCT analysis in essence evaluates a specific software package, and equivalence of other implementations of pCT analysis software cannot be assumed. However, the version of the software used in this study was not the most advanced, and subsequent refinements ought to improve reliability. Third, measurement of volumes within the constraints of a 2 cm brain slice does not represent the entire volume of an ischaemic lesion, and measurement errors might be greater (and correlations less impressive) if the entire brain volume was available. Finally, limited brain coverage by current multislice detectors may compromise the diagnostic sensitivity of pCT. However, it was not our aim to assess the sensitivity of the test to brain ischaemia, but rather the ability of visual inspection of immediately available pCT images to predict tissue fate.
Currently limited anatomical coverage of pCT may be outweighed by wider availability, fewer contraindications, better tolerability, easier patient monitoring, and proven ability to exclude haemorrhage compared with acute MRI.9 However, large doses of iodinated contrast may be associated with allergic reactions and renal impairment, and with lactic acidosis in individuals taking metformin. The radiation dose is also moderately high. Intolerance of prolonged brain imaging in acute stroke patients is largely dependent on the examination time, and may differ little from MRI.
Recent phase II trial results show that intravenous thrombolysis in patients with an MRI defined penumbra may be effective up to nine hours after onset.29 By yielding similar biological data, pCT provides an alternative that may also serve to select patients for clinical trials.
Acknowledgments
This study was supported by an NHS Programme Support Grant from the Chief Scientist’s Office, Scotland. The sponsor had no role in study design or analysis.
REFERENCES
Footnotes
-
Published Online First 20 October 2005
-
Competing interests: none declared