Article Text

Statistics from Altmetric.com
We have previously written about ‘denominator fallacy’ and its importance in the way that we report and interpret results, especially for endovascular treatment of acute stroke.1 In most studies, the number of patients going for endovascular thrombectomy (EVT) is taken as the denominator and the number of these patients achieving a modified Rankin Scale (mRS) of 0–2 as the numerator. The number of patients taken for EVT is dependent on the overall set-up, the view of the interventionalists, economic considerations (in some jurisdictions), imaging criteria, and clinical criteria. Of these, imaging criteria probably play a key role: the more stringent the imaging criteria (taking only patients with a very small core, etc), the smaller the number of patients who will go for EVT and the higher the likelihood of good clinical outcome (as a percentage of patients undergoing EVT). However, the more stringent the criteria, the smaller the overall impact of the treatment on the population as a whole. I used examples to illustrate this concept in a previous editorial.
However, let us take this line of reasoning a step further.
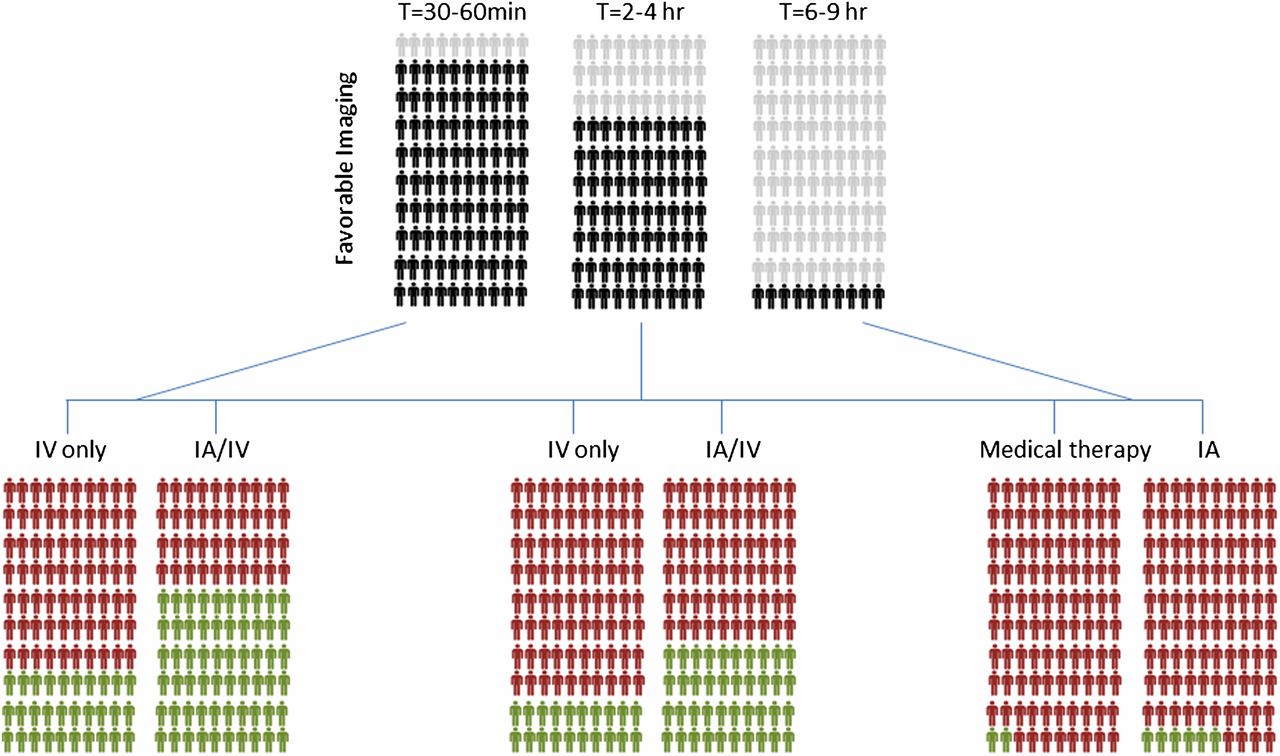
We know that time is brain and that infarcts grow during the hyperacute phase. At time zero after onset of symptoms, the size of the infarct core is zero. At 24 hours after onset, most infarcts are fully grown. Therefore it is clear that between 0 and 24 hours infarcts grow. Based on available data, it is quite likely that the overall curve for infarct growth is not linear but logarithmic with infarct growth being greater early on. Thus, it is likely that the earlier the imaging is performed after onset of the stroke, the higher is the likelihood of favorable imaging.2 If we had the ability to image 100 patients with M1 (middle cerebral artery, 1st segment) occlusion within 30–60 min of stroke onset, probably nearly all the patients would be eligible for EVT based on published and accepted criteria for small to moderate core (ASPECTS>5). Also if we could open most of these vessels quickly, 60% of these might have a good outcome.
How does the situation change if we have 100 patients with M1 occlusion presenting at 2 hours? There is no good dataset to answer this question but some of these patients will probably have poor collaterals (fast progressors) and already have a large core and hence are not eligible for EVT. Let us say 70 of these patients still have favorable imaging and undergo EVT. Of these approximately 60% have a good outcome: 40 patients (out of a total of 100 who presented in this time window). Going further at 4 hours from onset, it is possible that 50 patients have favorable imaging. Assuming a 60% good outcome after endovascular treatment, 30 of these patients do well (mRS 0–2) (figure 1).
Denominator fallacy: over time after the onset of symptoms, an increasing number of patients have large core infarct and are unlikely to benefit from revascularization therapy. For the purposes of this figure, it has been assumed that these have a bad outcome (modified Rankin Scale 3–6). At an early time point (30–60 min), nearly all patients (90%) have a small core infarct and are probably eligible for IA therapy. At 2–4 hours, 70% are probably eligible for IA therapy, whereas at a late time point (6–9 hours), only 10% of patients are eligible for therapy. Assuming a 30% response with IV therapy and 60% response with IA therapy (and keeping this consistent over time), the total impact at the population level dramatically reduces. Please note that the numbers used in this figure are merely estimates for illustrative purposes and more studies are needed to define the precise number of eligible patients at various time points.
What about at 6–9 hours? It is possible that only 10–20 out of 100 patients are eligible. In all the recent randomized trials,3 even those that allowed enrollment at later times like the ESCAPE trial, the median time from onset to randomization was surprisingly short. This may provide some indirect data to suggest that in the later time windows, many patients did not have favorable imaging. With successful EVT of 10 of those patients, and assuming a 60% good outcome, six of these patients have a good outcome. Let us say that late window trials show a 40% absolute effect size4 ,5 (which is actually quite ambitious): this would mean that two patients who did not undergo treatment would also have a good outcome. However, here is the problem: of 100 patients who presented in the late window with an M1 occlusion, two patients who did not undergo any treatment had a good outcome as opposed to six who did undergo EVT. What is our overall impact on the disease?
Now let us look at the problem in another way: we focus on systems of care, technologies, and education for better identification of large strokes in the field and direct referral to comprehensive stroke centers and let us say that we can create a system enabling all patients to arrive at the appropriate center 2 hours earlier. We know from the SWIFT PRIME data that the ‘drip and ship’ paradigm was on average 2 hours slower than the ‘mother-ship’ paradigm.6
So those 100 patients who were going to arrive later than 6 hours (with only 10% having favorable imaging) can now reach us at 4 hours and hence 50 of these would have favorable imaging. If the good outcome rate is kept the same, then at the end of treatment, instead of six patients having a good outcome, in this situation 30 would have a good outcome: an effect size of 500%!
In conclusion, using the number of patients undergoing EVT as the denominator can give us a false sense of success. The only denominator that makes sense is the total magnitude of disease in the population. Unfortunately, we do not have good datasets that include all patients with a large vessel occlusion irrespective of whether they are eligible for treatment or not. Given that (1) stroke due to large vessel occlusion is a devastating disease and (2) time is brain, we should focus our energies on systems of care enabling the correct patient to reach the correct hospital faster. Once at the correct hospital, the focus should be on speed, efficiency, and parallel processing to achieve safe and effective reperfusion. This would probably have greater impact than any improvements in imaging-based selection or reperfusion technologies.
Footnotes
Contributors MG conceived the idea. Both authors wrote the manuscript and provided critical input.
Competing interests None declared.
Provenance and peer review Not commissioned; externally peer reviewed.